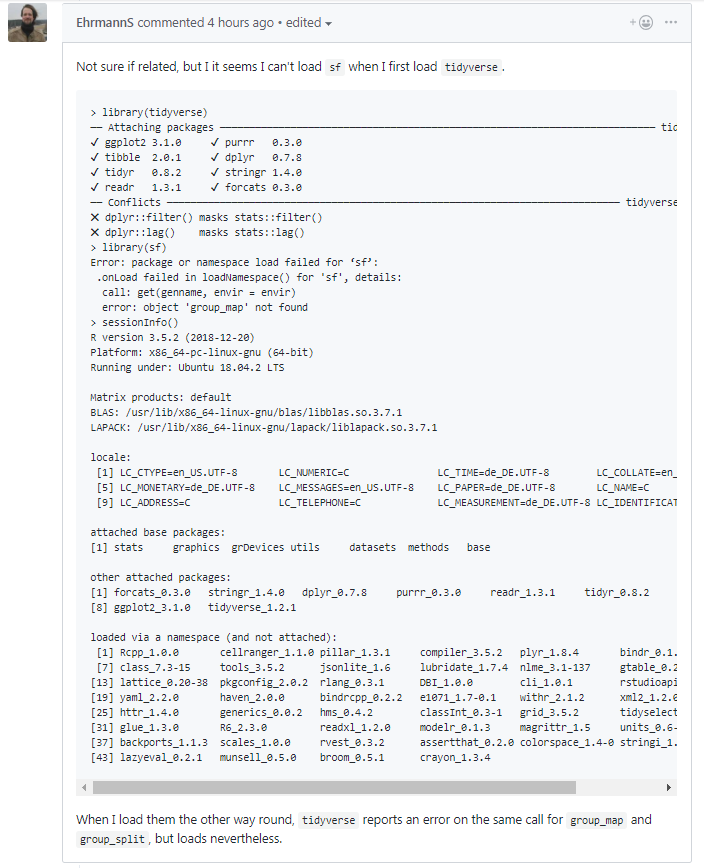
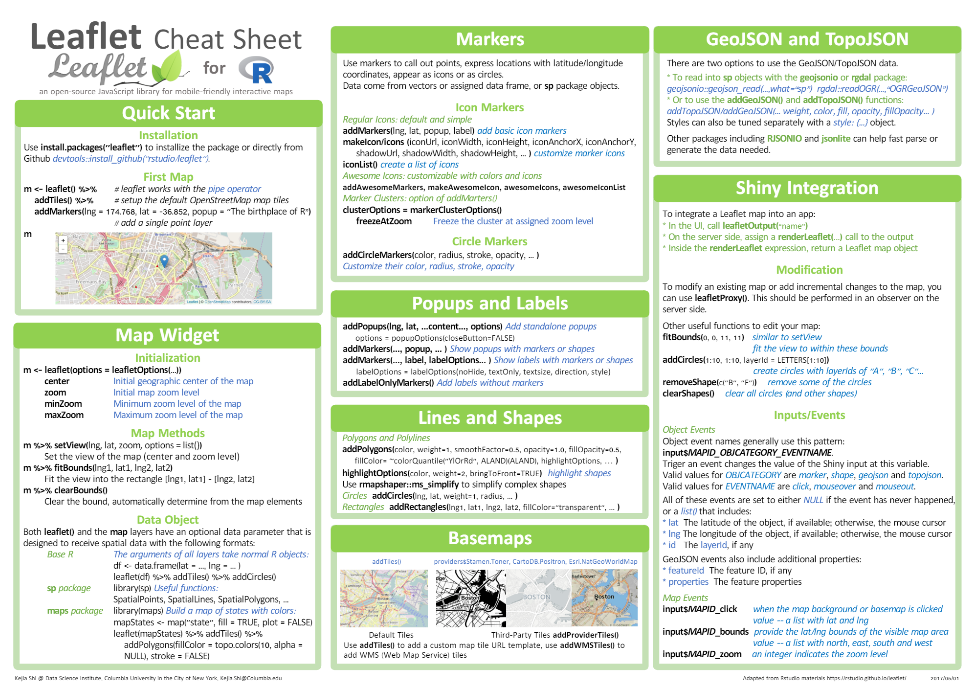
class: center, middle  <!-- Do not forget to adapt the presentation title in the header! --> <!-- Adjust the presentation to the session. Focus on the challenges, this is not a coding tutorial. Note, to include figures, store the image in the `/docs/assets/images` folder and use the jekyll base.url reference as done in this template or see https://jekyllrb.com/docs/liquid/tags/#links. using the scale attribute , you can adjust the image size. --> <!-- Adjust the day, month --> # 21 MARCH 2019 ## INBO coding club <!-- Adjust the room number and name --> Herman Teirlinck<br> 01.71 - Frans Breziers --- class: center, middle <!-- Create a new badge using Inkscape based on the assets/images/coding_club_badges.svg file -->  --- class: center, middle ### Recap .left[Got issues installing `sf` and `tidyverse`? During the last coding club, somebody from Germany [posted this](https://github.com/r-spatial/sf/issues/969#issuecomment-467367771).:] <br> --- class: center, middle ### Recap .left[Immediately got answer:] <br> Restart R (Ctrl+Shift+10) and then: ``` devtools::install_github("tidyverse/dplyr") ``` --- class: center, middle <br /> [`leaflet` cheatsheet](https://github.com/inbo/coding-club/blob/master/cheat_sheets/20190321_cheat_sheet_leaflet.pdf) and [`leaflet` online documentation](https://rstudio.github.io/leaflet/) --- class: center, middle ### How to get started? Check the [Each session setup](https://inbo.github.io/coding-club/gettingstarted.html#each-session-setup) to get started. ### First time coding club? Check the [First time setup](https://inbo.github.io/coding-club/gettingstarted.html#first-time-setup) section to setup. --- class: center, middle  --- class: center, middle ### Share your code during the coding session! <!-- Create a new hackmd file and replace this link (twice!) --> Go to https://hackmd.io/lWGlTDsuTOi0s4SVcAj6aA <iframe src="https://hackmd.io/lWGlTDsuTOi0s4SVcAj6aA" height="400px" width="800px"></iframe> --- class: left, middle ### Install required packages: ```r devtools::install_github("tidyverse/dplyr") install.packages(c("sf", "leaflet", "htmltools")) install.packages("BelgiumMaps.StatBel", repos = "http://www.datatailor.be/rcube", type = "source") ``` ### Load the required packages: ```r library(sf) library(tidyverse) library(BelgiumMaps.StatBel) library(leaflet) library(htmltools) ``` --- background-image: url(/assets/images/background_challenge_1.png) class: left, middle # Challenge 1 - Click [`20190321/20190321_n_crabs_provinces.csv`](https://github.com/inbo/coding-club/blob/master/data/20190321/20190321_n_crabs_provinces.csv) and download* data file to `./data` folder. - Click [`20190321/20190321_challenges.R`](https://github.com/inbo/coding-club/blob/master/src/20190321/20190321_challenges.R) and download* script in `./src` folder. <small>* __Note__: check the getting started instructions on [how to download a single file](https://inbo.github.io/coding-club/gettingstarted.html#each-session-setup)</small> - Start from the [`20190321/20190321_challenges.R`](https://github.com/inbo/coding-club/blob/master/src/20190321/20190321_challenges.R) file. For the data of 2016 only, make a [choropleth map](https://en.wikipedia.org/wiki/Choropleth_map) with ggplot. In other words, join the crab data to the provinces map and assign a color to each of the provinces map proportional to the number of crab occurrences in 2016. __Tip__: [Check the tutorial on ggplot_with_geom_sf](https://workshop.mhermans.net/thematic-maps-r/04_plot.html#ggplot_with_geom_sf) --- background-image: url(/assets/images/background_challenge_2.png) class: left, middle # Challenge 2 - Create an interactive map by using the `leaflet` package showing the same information as in challenge 1. You should end up with something like [this](/assets/images/20190321/20190321_crab_leaflet.html). __Tip__: get inspiration on [colors](https://rstudio.github.io/leaflet/colors.html) and [legends](https://rstudio.github.io/leaflet/legends.html). --- background-image: url(/assets/images/background_challenge_3.png) class: left, middle # Challenge 3 - Click [`20190321/20190321_crab_occurrences_2015.csv`](https://github.com/inbo/coding-club/blob/master/data/20190321/20190321_crab_occurrences_2015.csv) and download data file to `./data` folder. - Add occurrences from 2015 as circles in a leaflet map - Provide popups with information on the date of occurrence - Make sure the plot focuses on a small region around coordinate 51.1373384, 4.2813167 - Leaflet can also integrate existing online maps (e.g. WMS services) on the fly. Add WMS services from the Flemish environmental agency (VMM) about water as layers to the leaflet map. You could end up with something like [this](/assets/images/20190321/20190321_crab_occurrence_leaflet.html). __Tip__: [This tutorial](https://inbo.github.io/tutorials/tutorials/spatial_wms_services/#as-background-of-interactive-maps) on the INBO tutorials website explains how to add a WMS service to your leaflet map. The layers you can choice from the [VMM webservice](http://www.geopunt.be/catalogus/webservicefolder/4d361174-860d-ee21-4b3e-cafc-a2fc-2151-d3f42167) can be retrieved from [this page](https://geoservices.informatievlaanderen.be/raadpleegdiensten/VMM/wms?service=WMS&version=1.3.0&request=GetCapabilities). The pattern to look for is: ``` ... <Layer queryable="1"> <Name>Oppwwin</Name> <Title>Oppervlaktewaterwingebieden drinkwater</Title> ... ``` from which the text within `<Name>....</Name>` (in this case `Oppwwin`) is the layer name to use in the code. --- class: center, middle <!-- Always try to include some type of reviewing (can be short and entertaining). Remove this slide if no reviewing is included -->  --- class: center, middle  <!-- Adjust the room and date --> Room: Herman Teirlinck - 01.71 - Ferdinand Peeters<br> Date: __23/04/2019__, van 10:00 tot 12:00<br> (registration announced via DG_useR@inbo.be)