class: center, middle  <!-- Do not forget to adapt the presentation title in the header! --> <!-- Adjust the presentation to the session. Focus on the challenges, this is not a coding tutorial. Note, to include figures, store the image in the `/docs/assets/images` folder and use the jekyll base.url reference as done in this template or see https://jekyllrb.com/docs/liquid/tags/#links. using the scale attribute , you can adjust the image size. --> <!-- Adjust the day, month --> # 19 DECEMBER 2019 ## INBO coding club <!-- Adjust the room number and name --> Herman Teirlinck<br> 01.71 - Frans Breziers --- class: center, left While you all are hypnotized by this gif created with [`moveVis`](http://movevis.org/#get-started) package, I check the roomie out of the room.<br> 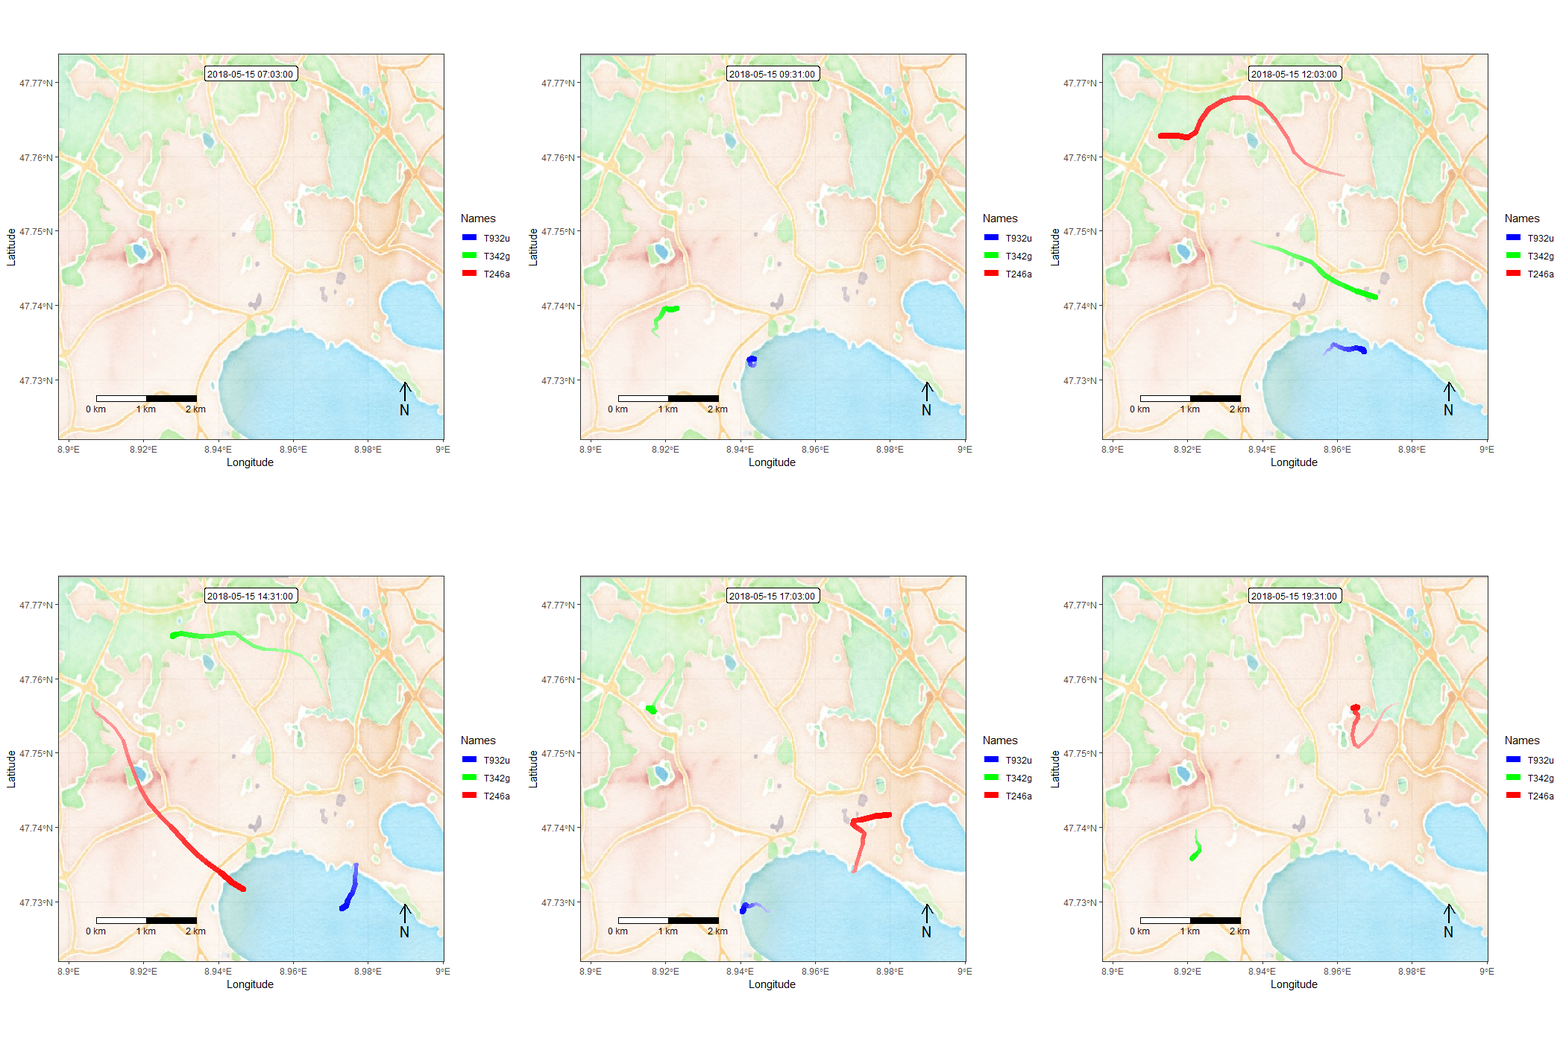 --- class: center, middle <!-- Create a new badge using Inkscape based on the assets/images/coding_club_badges.svg file -->  --- class: left, middle ## Recap: what did I learn during the last coding club? 1. The ggplot recipe: <strong>data - mapping - geometry</strong> 2. Mapping can be defined in the geometry (and often that's the case) 3. The most important mapping argument? **aes**thetics! 4. Put all arguments which require variables (= columns) in `aes()`, all other arguments outside. --- class: center, middle  [Download cheatsheet here](https://github.com/inbo/coding-club/blob/master/cheat_sheets/20180522_cheat_sheet_ggplot2.pdf) --- class: center, middle ### How to get started? Check the [Each session setup](https://inbo.github.io/coding-club/gettingstarted.html#each-session-setup) to get started. ### First time coding club? Check the [First time setup](https://inbo.github.io/coding-club/gettingstarted.html#first-time-setup) section to setup. --- class: center, middle  --- class: center, middle ### Share your code during the coding session! <!-- Create a new hackmd file and replace this link (twice!) --> Go to https://hackmd.io/hhmAidHlSwm8ITz6oE6ynA?both <iframe src="https://hackmd.io/hhmAidHlSwm8ITz6oE6ynA?both" height="440px" width="800px"></iframe> --- class: left, middle ### Install and load the package suite `install.packages("tidyverse")`<br> `library(tidyverse)` ### Install and load the INBO gglot theme `install.packages("INBOtheme")`<br> `library(INBOtheme)` --- class: left, middle ## Download data and source file - Click [`20191219/20191219_gam_fit_results.csv`](https://github.com/inbo/coding-club/blob/master/data/20191219/20191219_gam_fit_results.csv) and download* data file to `/data` folder. - Click [`20191219/20191219_survey_cleaned.csv`](https://github.com/inbo/coding-club/blob/master/data/20191219/20191219_survey_cleaned.csv) and download* data file to `/data` folder. - Click [`20191219/20191219_challenges.R`](https://github.com/inbo/coding-club/blob/master/src/20191219/20191219_challenges.R) and download* script file in `/src` folder. * __Note__: check the getting started instructions on [how to download a single file](https://inbo.github.io/coding-club/gettingstarted.html#each-session-setup) --- background-image: url(/assets/images/background_challenge_1.png) class: left, middle # Challenge 1 ## One plot, multiple geometries? Yes, we can Use dataframe `fit_results` to: 1. Plot number of observations (`obs`) versus time (`year`) and *facet* by species (`scientificName`). Arrange them in two rows and two columns. As y- and x- ranges are quit different among species, check that each plot has own y- and x-scale. 3. Add fit values (`fit` column) as red dotted line. 4. Add confidence interval area (lower value: `lcl`, upper value: `ucl`) with transparency equal to 0.3 and use purple as filling color. 5. Set "Number of observations in Belgian Natura2000 protected areas" as title and "Source: GBIF" as subtitle. 7. Left align both title and subtitles (`INBOtheme` centers authomatically title and subtitles). Your plot is now ready for being inserted in the paper. --- background-image: url(/assets/images/background_challenge_2.png) class: left, middle # Challenge 2 You submitted the paper. The reviewer likes the plot a lot. Still, he/she asked the following minor review: <br> <i>add a general plot above the subplots of previous challenge. I suggest to use area plots</i>. <br> Hint: you need a ggplot extension like `cowplot` or `egg`. --- class: left, middle ## Intermezzo: "Back to black" Do you like black backgrounds? Then you should try the themes from `ggdark` package! <br> Run: - `install.packages("ggdark")` - `library(ggdark)` and have fun!  --- class: left, middle background-image: url(/assets/images/background_challenge_3.png) # Challenge 3 ### Option 1 The reviewer from challenge 2 approved the paper! He likes it, but still... He/she is the typical graphic freak. He wrote: <i>Why not adding the official logo of gbif on the left next to the title instead of subtitle "Source: GBIF"?</i><br> Do not download the logo. Just use the link as provided in the R source code. <br> Hint: the [magick](https://ropensci.org/blog/2017/08/15/magick-10/) package does magic. <br>  --- class: left, middle background-image: url(/assets/images/background_challenge_3.png) # Challenge 3 ### Option 2 You don't have time to satisfy the reviewer: you need to <i>animate</i> a plot of an earlier submitted paper (see code in option 2 of challenge 3 in source R file). Another graphic freak reviewer suggested this minor review: <br> <i>instead of so many subplots, I would use an animation plot over date (year-month-day) to show the hidefoot length vs weight for all surveys taken **up to that date **.</i> <br> Hint: check out the brilliant [gganimate](https://gganimate.com/articles/gganimate.html) package, in particular its *transitions* functions in combination with *shadows* functions (see list of functions in [reference](https://gganimate.com/reference/index.html)). <br>  --- class: left, middle # Tutorials online There is a lot of documentation and tutorials online: 1. [Datacarpentry's data visualiation tutorial](https://datacarpentry.org/R-ecology-lesson/04-visualization-ggplot2.html) 2. [Stanford University tutorial](https://cengel.github.io/R-data-viz/data-visualization-with-ggplot2.html) 3. [R Graphics Cookbook, 2nd edition](https://r-graphics.org/): comprehensive 4. Selva Prabhakaran's [r-statistics.co](http://r-statistics.co/ggplot2-Tutorial-With-R.html): extensive tutorials (Tutorial 1,2,3). Tutorials on modelling and timeseries too. 5. [ggplot2 extensions](https://www.ggplot2-exts.org/gallery/) --- class: center, middle  <!-- Adjust the room and date --> Room: Herman Teirlinck - 01.05 - Isala Van Diest<br> Date: __28/01/2020__, van 10:00 tot 12:00<br> Title: **Data exploratory in R with tidyverse**<br> (registration announced via DG_useR@inbo.be)