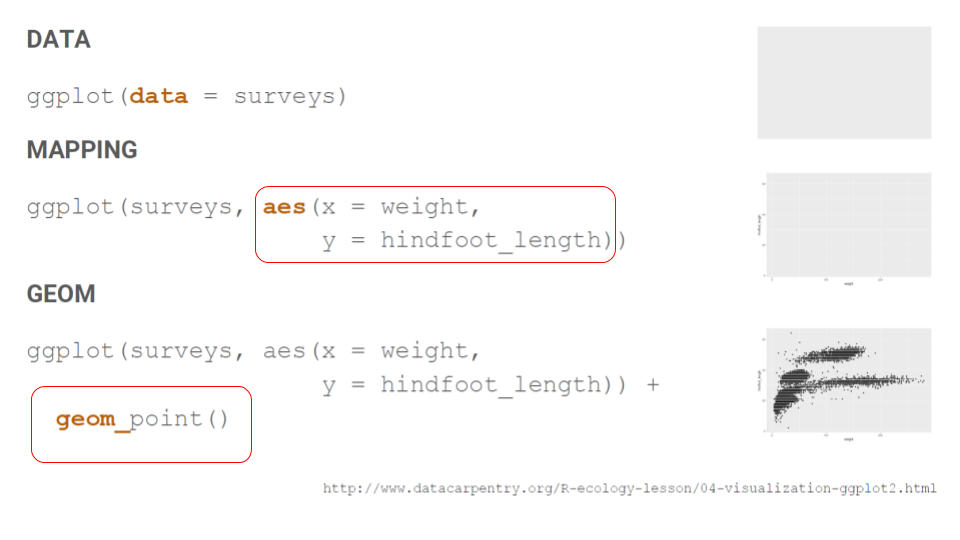
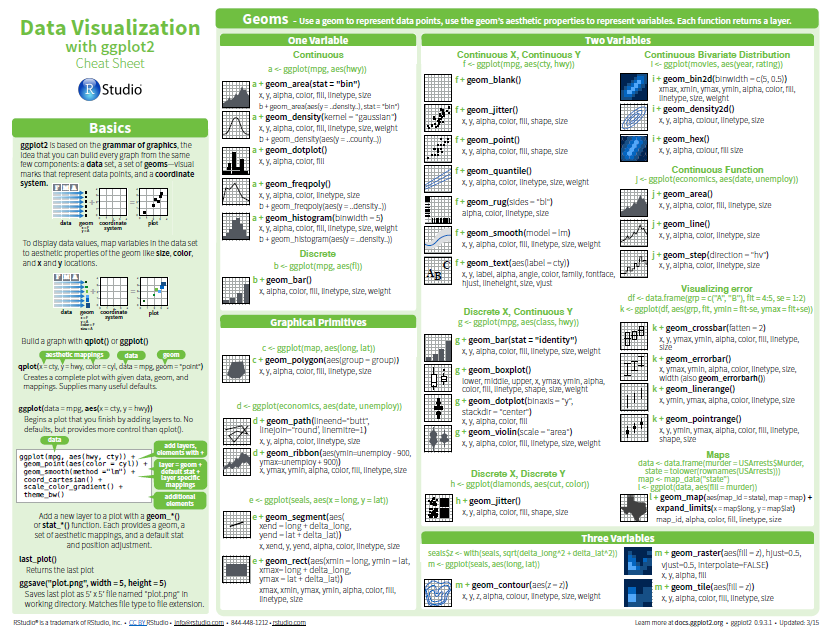
class: center, middle  <!-- Do not forget to adapt the presentation title in the header! --> <!-- Adjust the presentation to the session. Focus on the challenges, this is not a coding tutorial. Note, to include figures, store the image in the `/docs/assets/images` folder and use the jekyll base.url reference as done in this template or see https://jekyllrb.com/docs/liquid/tags/#links. using the scale attribute , you can adjust the image size. --> <!-- Adjust the day, month --> # 21 JANUARY 2020 ## INBO coding club <!-- Adjust the room number and name --> Herman Teirlinck<br> 06.C.03 --- class: center, left  --- class: center, middle 23rd January 2018: _"we started a little club..."_ <br> <br />  <br> <font size="+2">WHY?</font> --- class: center, middle  --- class: center, middle ## Mission statement The INBO Coding Club unites all ecologists, researchers and coders who want to develop their (R) programming skills in a pleasant and supportive environment in order to replace the fear for coding with inspiration and motivation to learn. --- class: left, middle ## Expect this - How to read the data with such awkward text format provided by OCOSA (Office for Complication of Otherwise Simple Affairs)? - What is the purpose of the `%>%` operator? - How can I _join_ two data.frames in R? - How to convert some scattered code into a reusable R function? - ... --- class: left, middle ## Do NOT expect this - Is a GLM the proper choice for my experiment? - How to implement a species distribution model? - What is machine learning? ## As coding club - is NOT a helpdesk - is NOT a scientific tutorial - is NOT a lunchtalk --- class: center, middle  --- class: left, middle ## So, practically... The coding club is held monthly on alternate Tuesday and Thursday, from 10 a.m. to 12 a.m., in Herman Teirlinck building (Tour & Taxis, Brussels). <br>  --- class: left, middle ## So, practically... - The coding club is typically limited to 25 participants (room capacity). It will soon increase to 40 from Jan, 2020 onwards - Each session focusses on a specific theme and is <u>independent</u> from previous sessions - No laptop, no party. We code, after all! --- class: center, middle ## Who organises the coding club? The dream team  --- class: left, middle ## Tasks The core team takes care of: - reservation of the lecture room - thematic topics, working material and some challenges to work on - general agenda: __take into account feedback from participants!__ - documentation for [participants](https://inbo.github.io/coding-club/gettingstarted.html) and [organizers](https://inbo.github.io/coding-club/workflow.html) (step-by-step workflow to organize a coding club) - [code of conduct](https://github.com/inbo/coding-club/blob/master/.github/CODE_OF_CONDUCT.md) --- class: left, middle ## Did we figure that out ourselves? No :-) <br> <br /> Some initiatives we got inspiration from: - [ourcodingclub Edinburgh](https://ourcodingclub.github.io/). - initiatives showing that coding together can sensibly improve ecological/environmental research. See the [Ocean Health Index project paper](https://www.nature.com/articles/s41559-017-0160). - Software and Data Carpentry organisation: bye bye coding fear! See their inspiring [ecology workshop](http://www.datacarpentry.org/lessons/#ecology-workshop). --- class: center, middle ## Resources INBO coding club material is open and available online. <br> <br /> https://inbo.github.io/coding-club/ <br> <br /> Let's start. --- class: center, middle <!-- Create a new badge using Inkscape based on the assets/images/coding_club_badges.svg file -->  --- class: center, middle ### First time coding club? Most likely YES. <br> Let's run, all together, the steps in [First time setup](https://inbo.github.io/coding-club/gettingstarted.html#first-time-setup) section to setup our coding club directory. --- class: center, middle  --- class: center, middle ### Share your code during the coding session! <!-- Create a new hackmd file and replace this link (twice!) --> Go to https://hackmd.io/mv-Ng9V5R2KZyQbUUFmDcA?both <iframe src="https://hackmd.io/mv-Ng9V5R2KZyQbUUFmDcA?both" height="440px" width="800px"></iframe> --- --- class: left, middle ### Install and load packages <p>Load tidyverse<br> `library("tidyverse")`</p> <P>Some datasets are saved as .xlsx files. You need to install `readxl`<br> `install.packages("readxl")`</P> <p>Load it in your R session by typing:<br> `library("readxl")`<br> --- class: left, middle ## Download data and source file - Go to [`data`](https://github.com/inbo/coding-club/tree/master/data) - All you datasets are saved with prefix `20200121`. Click on yours and download* it to `/data` folder on your laptop. - Click [`20200121/20200121_challenges.R`](https://github.com/inbo/coding-club/blob/master/src/20200121/20200121_challenges.R) and download* script file in `/src` folder on your laptop. * __Note__: check the getting started instructions on [how to download a single file](https://inbo.github.io/coding-club/gettingstarted.html#each-session-setup) --- class: left, middle ### Cheatsheets and documentation Before starting, some link to documentation and cheatsheets we can need to solve the challenges: - [`readxl` package documentation](https://readxl.tidyverse.org/) to import Excel files in R. - [data import cheatsheet](https://github.com/inbo/coding-club/blob/master/cheat_sheets/20180123_cheat_sheet_data_import.pdf) for importing text files (`txt`, `csv`, `tsv`) in R. - See [data transformation cheatsheet](https://github.com/inbo/coding-club/blob/master/cheat_sheets/20181129_cheat_sheet_data_transformation.pdf) for exploring data.frames. - See [ggplot cheatsheet](https://github.com/inbo/coding-club/blob/master/cheat_sheets/20180522_cheat_sheet_ggplot2.pdf) for help making graphs. --- background-image: url(/assets/images/background_challenge_1.png) class: left, middle # Challenge 1. Import Import your dataset: 1. `xlsx`, `xls` files? Use `read_excel()` function. 2. `txt`, `csv` (text) files? Use `read_delim` function. - What is the `head()` of your data.frame? - What is the `str()`ucture of your data.frame? - Did you know you can inspect some `summary()` statistics? - Did you know you can get `nrow()` and `ncol()`? --- background-image: url(/assets/images/background_challenge_2.png) class: left, middle # Challenge 2. Explore - Did you know you can get `distinct()` rows, so removing duplicated rows if present? - Did you know you can `filter()` rows? 1. `count()` how many NAs you have in a column. Tip: use `is.na()` 2. Filter rows with NAs in a specific column out and assign the result as a new data.frame - Did you know you can `select()` columns? - Did you know you can `rename()` columns? - Calculate `min()`, `max()` and `mean()` of a column - How to calculate how many distinct values are in a column? Tip: it is on 2nd page of [data transformation cheatsheet](https://github.com/inbo/coding-club/blob/master/cheat_sheets/20181129_cheat_sheet_data_transformation.pdf). --- class: left, middle # Intermezzo: this `%>%` is a pype Why using `%>%`? <br> Try this:<br> ``` select(filter(iris, Sepal.Length > 7.5), Petal.Length, Petal.Width, Species) ``` Can you understand what I have done here?<br> Maybe this is better... ``` iris %>% filter(Sepal.Length > 7.5) %>% select(Petal.Length, Petal.Width, Species) ``` `%>%` makes programming and code reading easier. Life is easy with a pipe... --- class: left, middle # Intermezzo: the ggplot recipe What do you need to make a plot? The ggplot recipe says you need: 1. data 2. mapping (essentially which columns you want to use) 3. geometry (do you want a bar plot, line plot, histogram, ...?)  --- class: left, middle background-image: url(/assets/images/background_challenge_3.png) # Challenge 3. Visualize 1. Make two basic plots from your data based on intermezzo 2. Customize them a little more and make them shining <br> You can check the [ggplot cheatsheet](https://github.com/inbo/coding-club/blob/master/cheat_sheets/20180522_cheat_sheet_ggplot2.pdf) or search on internet. Everybody does, you know... --- class: left, middle # Tutorials online There is a lot of documentation and tutorials online: 1. Datacarpentry: [Data Analysis and Visualization in R for Ecologists](https://datacarpentry.org/R-ecology-lesson/): the most clear and comprehensive lesson on using R for ecology data ever. 2. [Stanford University tutorial about ggplot2](https://cengel.github.io/R-data-viz/data-visualization-with-ggplot2.html). 3. [R Graphics Cookbook, 2nd edition](https://r-graphics.org/): comprehensive --- class: center, middle  <!-- Adjust the room and date --> Room: Herman Teirlinck - 01.05 - Isala Van Diest<br> Date: __28/01/2020__, van 10:00 tot 12:00<br> Title: **Data exploratory in R with tidyverse**<br> (registration via [gsheet](https://docs.google.com/spreadsheets/d/1D80p7lxLUnWUxEkTIYOMhhYdL39kZOKgKmLOXsr4HGM/edit#gid=967842163))