class: center, middle  <!-- Do not forget to adapt the presentation title in the header! --> <!-- Adjust the presentation to the session. Focus on the challenges, this is not a coding tutorial. Note, to include figures, store the image in the `/docs/assets/images` folder and use the jekyll base.url reference as done in this template or see https://jekyllrb.com/docs/liquid/tags/#links. using the scale attribute , you can adjust the image size. --> <!-- Adjust the day, month --> # 28 APRIL 2020 ## INBO coding club <!-- Adjust the room number and name --> Online<br> Home, sweet home --- class: center, middle <!-- Create a new badge using Inkscape based on the assets/images/coding_club_badges.svg file -->  --- class: left, middle - [Thematic maps tutorial](https://workshop.mhermans.net/thematic-maps-r/index.html) - [`leaflet` online documentation](https://rstudio.github.io/leaflet/) <br> - [`leaflet` cheat sheet](https://github.com/inbo/coding-club/blob/master/cheat_sheets/20190321_cheat_sheet_leaflet.pdf) --- class: center, middle ### How to get started? Check the [Each session setup](https://inbo.github.io/coding-club/gettingstarted.html#each-session-setup) to get started. ### First time coding club? Check the [First time setup](https://inbo.github.io/coding-club/gettingstarted.html#first-time-setup) section to setup. --- class: left, middle 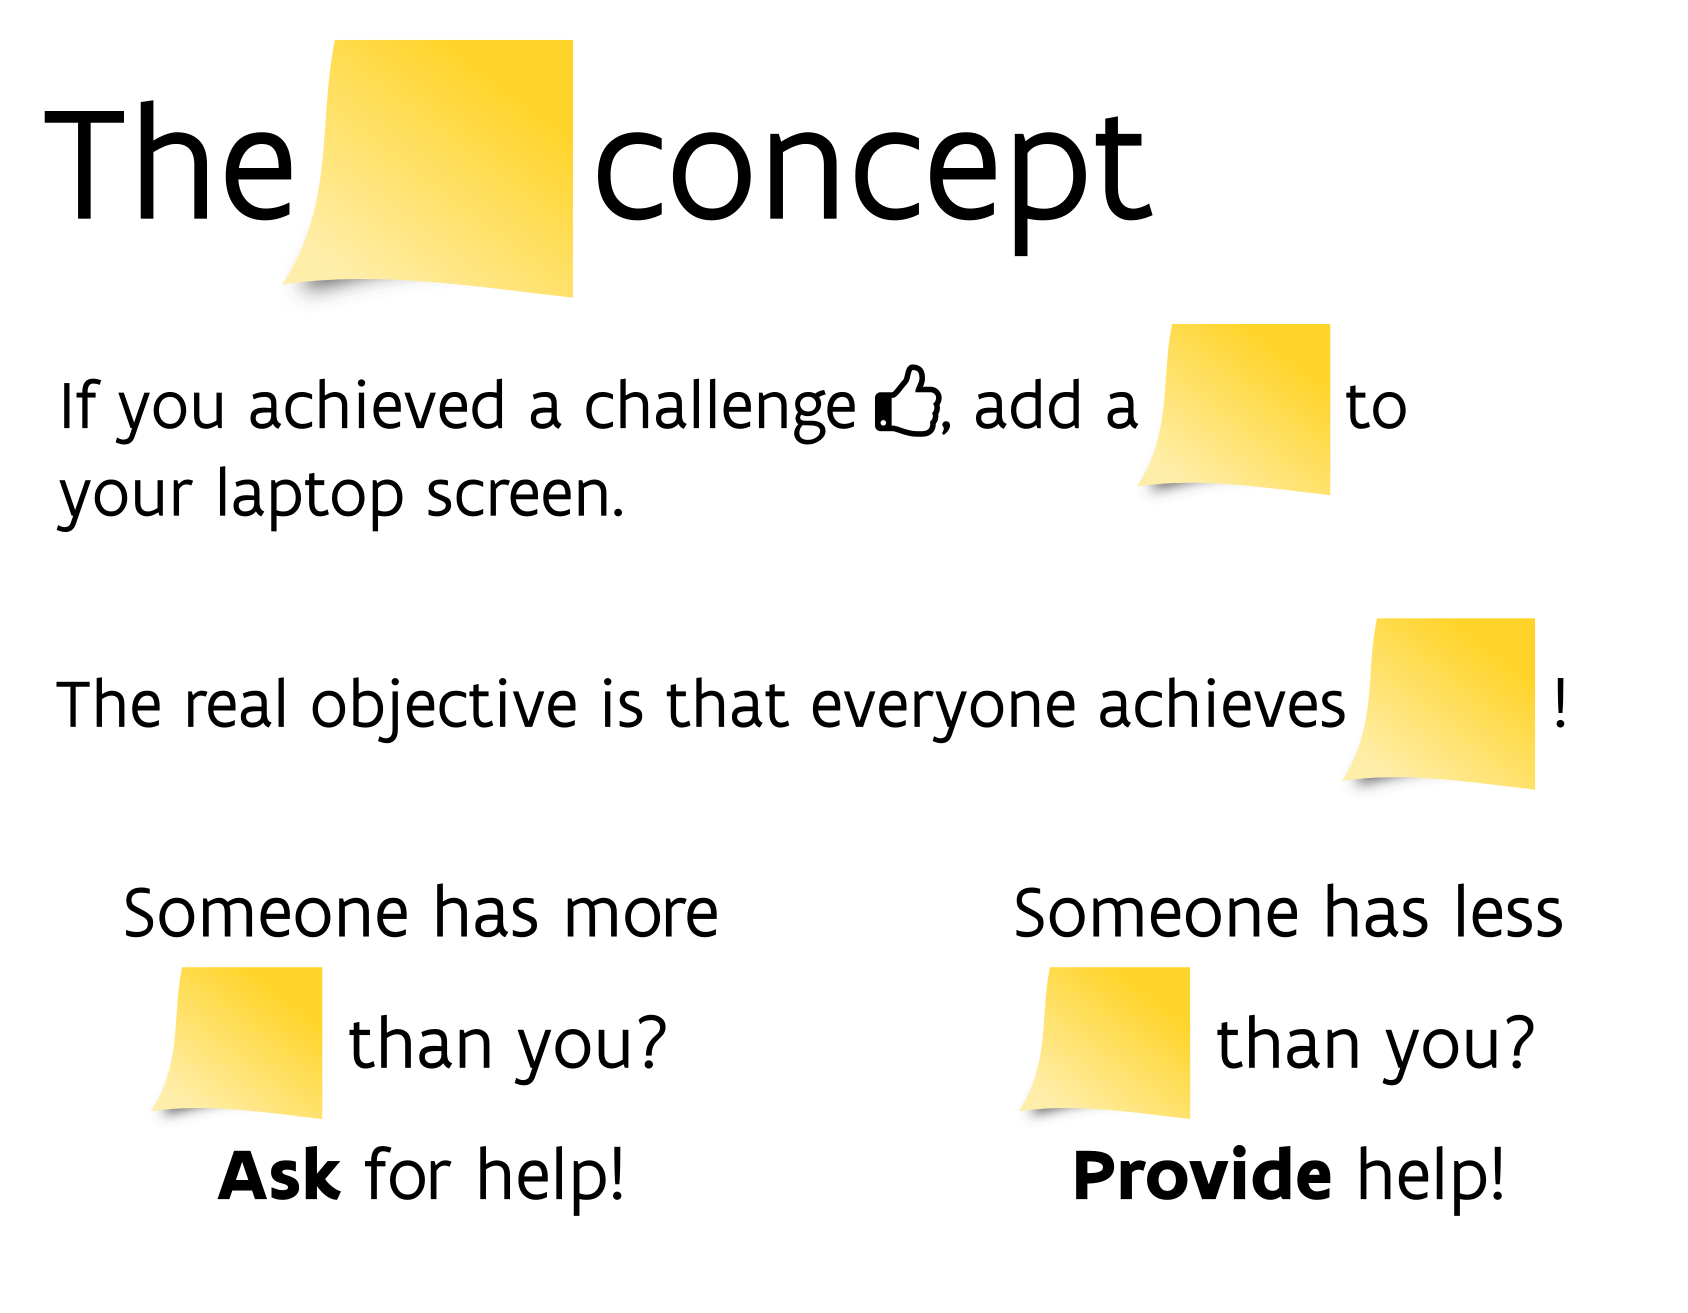 <br> No yellow sticky notes online :-( We use hackmd (see next slide) but basic principle doesn't change. --- class: center, middle ### Share your code during the coding session! <!-- Create a new hackmd file and replace this link (twice!) --> Go to https://hackmd.io/1JeUgfKNRPeXTfk2lqP2AA?both <iframe src="https://hackmd.io/1JeUgfKNRPeXTfk2lqP2AA?both" height="400px" width="800px"></iframe> --- class: left, middle ### Install required packages: Packages we need, as mentioned by e-mail on Friday: ```r install.packages(c("sf", "leaflet", "htmltools", "tmap")) install.packages("BelgiumMaps.StatBel", repos = "http://www.datatailor.be/rcube", type = "source") ``` Install also `tidyverse` if you have not done before. ### Load the required packages: ```r library(tidyverse) library(sf) library(BelgiumMaps.StatBel) library(leaflet) library(htmltools) library(tmap) ``` --- class: left, middle # Download data and code Today we will use an R script and a dataset. Download* the R script in your folder `src ` and the dataset in your folder `data`. - R script: [20200428/20200428_challenges.R](https://github.com/inbo/coding-club/blob/master/src/20200428/20200428_challenges.R) - Dataset of some butterfly observations in Belgium [20200326/20200326_butterflies.txt](https://github.com/inbo/coding-club/blob/master/data/20200326_butterflies.txt), already used on March. <small>* __Note__: check the getting started instructions on [how to download a single file](https://inbo.github.io/coding-club/gettingstarted.html#each-session-setup)</small> --- background-image: url(/assets/images/background_challenge_1.png) class: left, middle # Challenge 1 Starting from the [`20200428/20200428_challenges.R`](https://github.com/inbo/coding-club/blob/master/src/20200428/20200428_challenges.R) file: - Plot a map with Belgian provinces using `tmap`. Fill the provinces with a color based on their area (column `SURFACE.GIS.km2`) and provide a nice title to the legend, i.e. "Area (km2)". Hint:[Building Maps In Layers](https://workshop.mhermans.net/thematic-maps-r/04_plot.html#building_maps_in_layers) - Divide them by region using facets. Hint: [multiple Maps Facets](https://workshop.mhermans.net/thematic-maps-r/04_plot.html#multiple_maps__facets) You could end up with something like [this](/assets/images/20200428/20200428_example_provinces_tmap.html). --- background-image: url(/assets/images/background_challenge_2.png) class: left, middle # Challenge 2 Starting from the [`20200428_challenges.R`](https://github.com/inbo/coding-club/blob/master/src/20200428/20200428_challenges.R) file: - Generate a *leaflet* map centered at lng 4.89 and lat 51.01 with zoom level 7. Hint: [Basemaps](https://rstudio.github.io/leaflet/basemaps.html) - Add markers at butterfly observations coordinates (`decimal_longitude`, `decimal_latitude`). Cluster them using the cluster option. Hint:[Markers](https://rstudio.github.io/leaflet/markers.html) - Add pop-ups to the markers showing the date, e.g. "Date: 2015-09-20". Add also labels to the markers showing the species, e.g. "Atalanta". Hint: [Popups and Labels](https://rstudio.github.io/leaflet/popups.html) 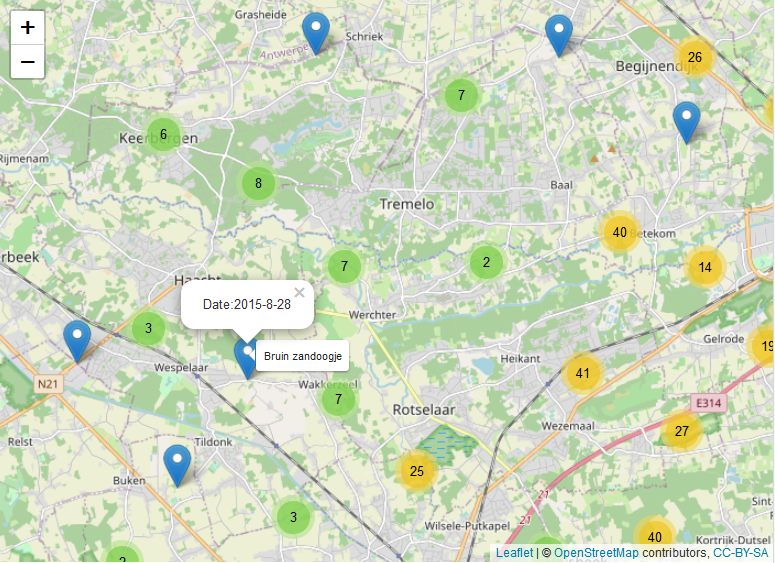 --- background-image: url(/assets/images/background_challenge_3.png) class: left, middle # Challenge 3 Starting from the [`20200428/20200428_challenges.R`](https://github.com/inbo/coding-club/blob/master/src/20200428/20200428_challenges.R) file: - Make a choropleth map of belgian provinces based on their area (column `SURFACE.GIS.km2`). Provide a legend as well. Hint: [Choropleths](https://rstudio.github.io/leaflet/choropleths.html) and [Legends](https://rstudio.github.io/leaflet/legends.html) - Add markers at the centroids of the provinces. Add labels using the Dutch name of the provinces (column `TX_PROV_DESCR_NL`) 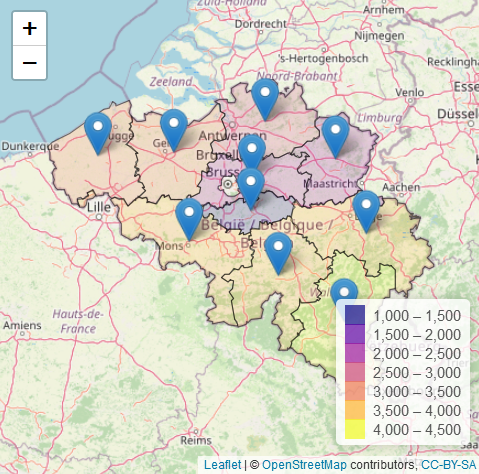 --- class: left, middle # Bonus challenge Starting from the [`20200428/20200428_challenges.R`](https://github.com/inbo/coding-club/blob/master/src/20200428/20200428_challenges.R) file: - Show the observations of common brimstone (citroenvlinder), large tortoiseshell (grote vos), small tortoiseshell (kleine vos) and orange tip (oranjetipje) as **circles** whose radius in meters is equal to the uncertainty (column `coord_uncertainty_in_meters`) and the color represents the species. Provide a legend for the colors. Hint: [shapes](https://rstudio.github.io/leaflet/shapes.html) - Add also a layer with provinces and correspondent legend. Let the user to show/hide the layers and their legends and to choose between Esri.WorldImagery and the default Open Street Map as background. Hint: [Show/Hide Layers](https://rstudio.github.io/leaflet/showhide.html) . --- class: left, middle # Resources 1. [Thematic maps in R](https://workshop.mhermans.net/thematic-maps-r/index.html) workshop 2. [Leaflet for R tutorial](https://rstudio.github.io/leaflet/) 3. [INBO tutorial](https://inbo.github.io/tutorials/tutorials/spatial_wms_services/#as-background-of-interactive-maps) on how to add a Web Map Service (WMS) to your leaflet map 4. More challenges from [coding club session - March 2019](https://inbo.github.io/coding-club/sessions/20190321_gis_maps.html#1) 5. Explore also [`mapview`](https://r-spatial.github.io/mapview/) package: a wrapper around `leaflet` to create very quickly and conveniently (not presentation grade) interactive plotting of spatial data. 6. [Challenge solutions](https://github.com/inbo/coding-club/blob/master/src/20200428/20200428_challenges_solution.R) --- class: center, middle  <!-- Adjust the room and date --> Room: 01.05 - Isala Van Diest (?)<br> Date: __28/05/2020__, van 10:00 tot 12:00<br> (registration announced via DG_useR@inbo.be)