class: center, middle  <!-- Do not forget to adapt the presentation title in the header! --> <!-- Adjust the presentation to the session. Focus on the challenges, this is not a coding tutorial. Note, to include figures, store the image in the `/docs/assets/images/yyyymmdd/` folder and use the jekyll base.url reference as done in this template or see https://jekyllrb.com/docs/liquid/tags/#links. using the scale attribute , you can adjust the image size. --> <!-- Adjust the day, month --> # 25 FEBRUARY 2021 ## INBO coding club <!-- Adjust the room number and name --> Exclusively on dIsNeyBO+ --- class: center, middle <!-- Create a new badge using Inkscape or other programs based on the assets/images/coding_club_badges.svg file -->  --- class: center, middle 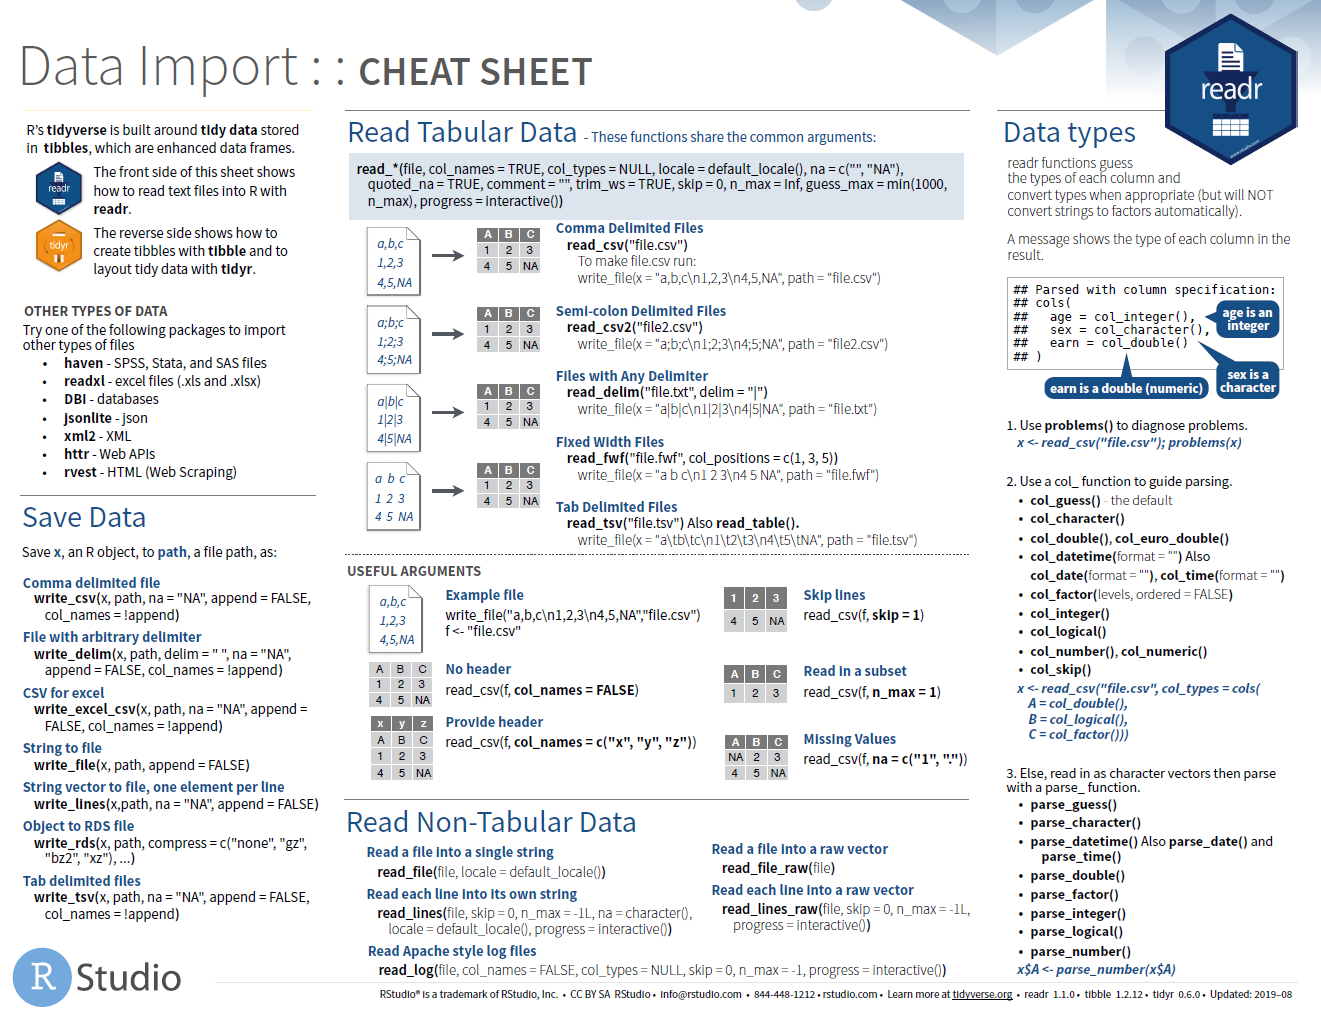 [Download cheatsheet here](https://github.com/inbo/coding-club/blob/master/cheat_sheets/20210225_cheat_sheet_data_import.pdf) --- class: center, middle ### How to get started? Check the [Each session setup](https://inbo.github.io/coding-club/gettingstarted.html#each-session-setup) to get started. ### First time coding club? Check the [First time setup](https://inbo.github.io/coding-club/gettingstarted.html#first-time-setup) section to setup. --- class: left, middle  <br> No yellow sticky notes online :-( We use hackmd (see next slide) but basic principle doesn't change. --- class: center, middle ### Share your code during the coding session! <!-- Create a new hackmd file and replace this link (twice!) --> Go to https://hackmd.io/xm_RYj5xTGOh0jHQiiu9_A?edit <iframe src="https://hackmd.io/xm_RYj5xTGOh0jHQiiu9_A?edit" height="400px" width="800px"></iframe> --- class: left, middle # Download data and code Instead of downloading the files manually we have a `inborutils` function called `setup_codingclub_session()`. If you have not used this function yet, restart your R session and update the `inborutils` package by running: ```r if (!"remotes" %in% rownames(installed.packages())) { install.packages("remotes") } remotes::install_github("inbo/inborutils") ``` To download the coding club material of today, just run `setup_codingclub_session()`. In general, you can use the date in "YYYYMMDD" format , e.g. `setup_codingclub_session("20201027")`, to download the coding club material of October, 27 2020. For all options, check the [tutorial online](https://inbo.github.io/tutorials/tutorials/r_setup_codingclub_session/). Of course, you can still download [data](https://github.com/inbo/coding-club/blob/master/data/20210225/) and [scripts](https://github.com/inbo/coding-club/blob/master/src/20210225/) manually*! <small>* __Note__: check the getting started instructions on [how to download a single file](https://inbo.github.io/coding-club/gettingstarted.html#each-session-setup)</small> --- class: left, middle ## Challenge 0 - Install packages* ```r # install readr if not already installed if (!"readr" %in% installed.packages()) { install.packages("readr") } # install readxl if not already installed if (!"readxl" %in% installed.packages()) { install.packages("readxl") } if (!"googlesheets4" %in% installed.packages()) { install.packages("googlesheets4") } ``` - Load packages ```r library(readr) library(readxl) library(googlesheets4) ``` <p> <small>*Note: All these packages are part of the tidyverse universe</small> </p> --- class: center, middle 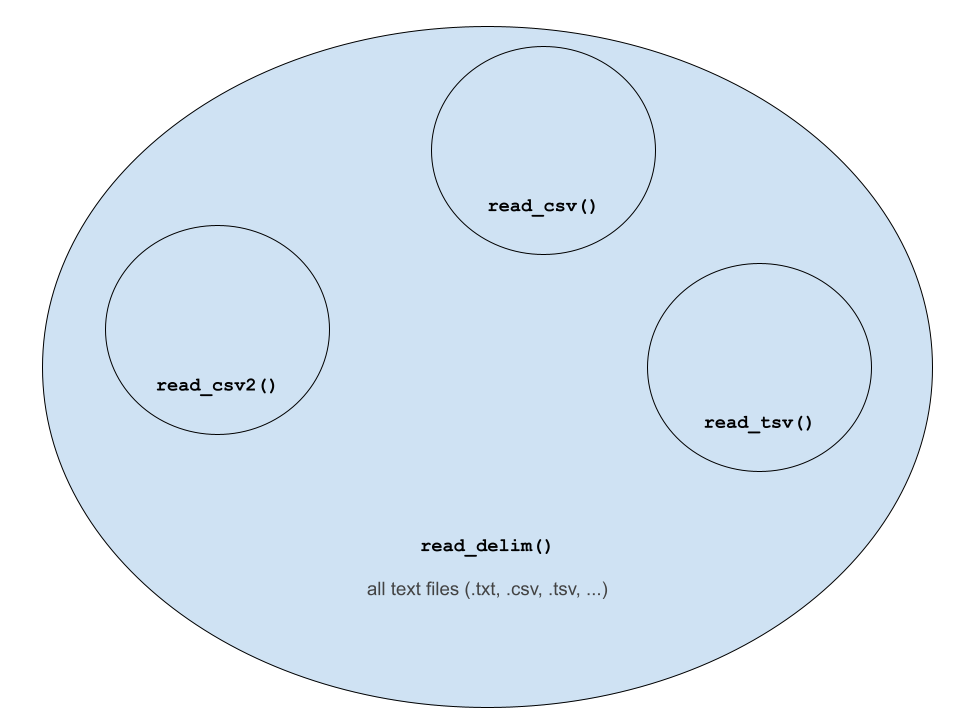 Welcome to the `read_*` world! --- background-image: url(/assets/images/background_challenge_1.png) class: left, middle # Challenge 1 1. Read a set of research grade observations from file [`20210125_occurrence_iNaturalist_researchgrade_obs.txt`](https://github.com/inbo/coding-club/blob/master/data/20210225/20210125_occurrence_iNaturalist_researchgrade_obs.txt) 2. Read datafile [`20210225_gent_groeiperwijk.csv`](https://github.com/inbo/coding-club/blob/master/data/20210225/20210225_gent_groeiperwijk.csv) containing the demographic evolution of Ghent districts from 1999 to 2009 3. Read sheet `ALL DATA` from Excel datafile [`20210225_manta_2014_2015.xlsx`](https://github.com/inbo/coding-club/blob/master/data/20210225/20210225_manta_2014_2015.xlsx) with manta related data* 4. Something more difficult now! Read butterfly related data file [`20210225_butterflies_counts.txt`](https://github.com/inbo/coding-club/blob/master/data/20210225/20210225_butterflies_counts.txt) with semicolon (;) as delimiter, dot (.) as decimal mark and question mark (?) as NA. Read only the first 500 rows. Be sure column `Date` is parsed as datetime by using `format = "%d/%m/%Y %H:%M:%S"` <small>* __Note__: first line contains metadata about the type of variables. This is done by grouping cells, which is not really computer readable, as it is an example of untidy data. Same for the use of colors in cells. In next coding club we will come back on this topic and how to make data both human and computer readable. Stay tuned!</small> --- class: center, middle # Intermezzo: `datapasta` package The package [`datapasta`](https://milesmcbain.github.io/datapasta/) can simplify your life enormously. Watch [this Youtube video](https://youtu.be/Sz-tEVqZh5s?t=43). Yes, you can copy-paste a table from web or Excel directly to R, thanks to the datapasta's function `df_paste()`!  --- background-image: url(/assets/images/background_challenge_2.png) class: left, middle # Challenge 2: googlesheets [`googesheets4`](https://googlesheets4.tidyverse.org/) needs access to your Google account. First time you use this package you will need to authorize it. 1. Read the sheet `HyaHoVrBl` from a googlesheet about [hyacint coverage in Ename](https://docs.google.com/spreadsheets/d/1Tc8U-ud4dEcxgOojS80w7gdQQ-Ac85A4dN-u47NSmYg) paying attention to import all columns correctly 2. Get metadata of the googlesheet in 1 3. But what if you don't want to allow tidyverse API to get access to your INBO Google account? Well, you can publish the sheet to the web* as csv and then import it via `read_delim()` or `read_csv()`. Read the csv generated in this way by using this link: ```r hyacint_cov_link <- "https://docs.google.com/spreadsheets/d/e/2PACX-1vRFAWYrZmgBRPXQnw3Io5T_29ZrGkH-Ds4yulFd02MIPcalGPtzyQ3cujgAdwzfnRNYIWQFf1oKjgM3/pub?gid=1007047746&single=true&output=csv" ``` <small>* __Note__: This method is useful if you don't have a limited number of publicly available Googlesheets.</small>  --- class: left, middle ## INTERMEZZO: _locale_ A [locale](https://readr.tidyverse.org/articles/locales.html) encapsulates common options that vary between languages and localities. ```r > Sys.localeconv() decimal_point thousands_sep grouping int_curr_symbol currency_symbol mon_decimal_point mon_thousands_sep "." "" "" "USD" "$" "." "," mon_grouping positive_sign negative_sign int_frac_digits frac_digits p_cs_precedes p_sep_by_space "\003" "" "-" "2" "2" "1" "0" n_cs_precedes n_sep_by_space p_sign_posn n_sign_posn "1" "0" "3" "0" ``` Get locale for Dutch :-) ```r > locale("nl") <locale> Numbers: 123,456.78 Formats: %AD / %AT Timezone: UTC Encoding: UTF-8 <date_names> Days: zondag (zo), maandag (ma), dinsdag (di), woensdag (wo), donderdag (do), vrijdag (vr), zaterdag (za) Months: januari (jan.), februari (feb.), maart (mrt.), april (apr.), mei (mei), juni (jun.), juli (jul.), augustus (aug.), september (sep.), oktober (okt.), november (nov.), december (dec.) AM/PM: a.m./p.m. > locale("nl") %>% names [1] "date_names" "date_format" "time_format" "decimal_mark" "grouping_mark" "tz" "encoding" ``` --- background-image: url(/assets/images/background_challenge_3.png) class: left, middle # Challenge 3 You get the data file [`20210225_rainfall_waterloo.csv`](https://github.com/inbo/coding-club/blob/master/data/20210225/20210225_rainfall_waterloo.csv) containing meteorological data from Wallonia (Waterloo) in Walloon and using apex (') as grouping mark (e.g. 1000 -> 1'000) Be aware of these three aspects: 1. Parse column `Hour` as a column containing number (by default read as a character column) 2. Parse both columns `Absolute Value` and `AV Quality Code` as numeric columns paying attention to define the right `grouping_mark`. Hint: check the structure of a typical locale, e.g. nl <- locale("nl") 3. Parse the column `Date` as a date column. Hint: look at the readr's [`locale` vignette](https://readr.tidyverse.org/articles/locales.html) and again check the structure of a typical _locale_. For finding the right datetime parsing, this is a nice datetime [format specifications compendium](https://www.stat.berkeley.edu/~s133/dates.html) These are the days, months and correspondent abbreviations in Walloon: ```r days_walloon <- c("londi", "mårdi", "mierkidi", "djudi", "vénrdi", "semdi", "dimegne") months_walloon <- c("djanvî","fevrî", "måss", "avri", "may", "djun", "djulete", "awousse","setimbre", "octôbe", "nôvimbe", "decimbe") days_abbr_walloon <- c("lon", "mår", "mie", "dju", "vén", "sem", "dim") months_abbr_walloon <- c("djan","fev", "mås", "avr", "may", "djun", "djul", "awou","set", "oct", "nôv", "dec") ``` --- class: left, middle # Bonus challenge Let's help each other! Do you have a cryptic datafile? Or did you succeed to import it but it was a real challenge? Share them with us! Add them to this Google Drive folder [20210225 - datafiles](https://drive.google.com/drive/u/0/folders/114Kvg6KNkFk8P8gCKZvu6bdhNY9nKRIe) (sign-in required) --- class: left, middle ## Resources - [R script](https://github.com/inbo/coding-club/blob/master/src/20210225/20210225_challenges_solutions.R) with challenge solutions - video recording available on [vimeo](https://vimeo.com/519026595) - [readr package documentation](https://readr.tidyverse.org/) - [data import cheat sheet](https://github.com/inbo/coding-club/blob/master/cheat_sheets/20210225_cheat_sheet_data_import.pdf): first page is all about `readr` package - [INBO tutorial about reading Googlesheets in R](https://inbo.github.io/tutorials/tutorials/r_google_sheets/) via tidyverse package `googlesheets4` - [`readxl` package documentation](https://readxl.tidyverse.org/) to read Excel files - a wonderful date and time [format specifications compendium](https://www.stat.berkeley.edu/~s133/dates.html) - homepage of [`datapasta`](https://milesmcbain.github.io/datapasta/) package --- class: center, middle  <!-- Adjust the room and date --> Room: 01.05 - Isala Van Diest(?)<br> Date: __30/03/2021__, van 10:00 tot 12:00<br> Subject: **tidy data** <br> (registration announced via DG_useR@inbo.be)