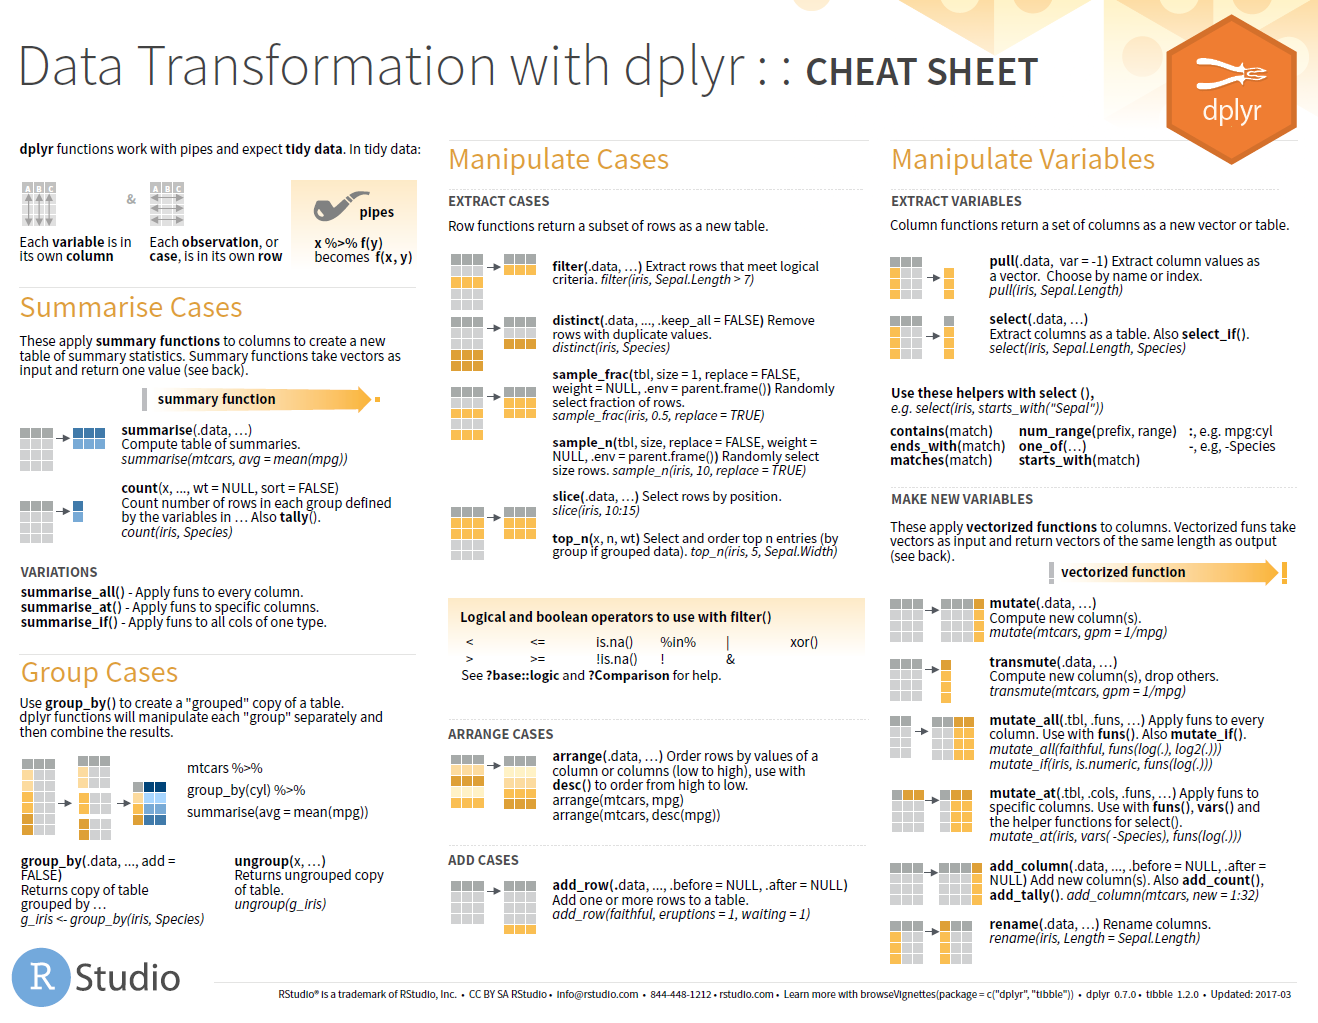
class: center, middle  <!-- Do not forget to adapt the presentation title in the header! --> <!-- Adjust the presentation to the session. Focus on the challenges, this is not a coding tutorial. Note, to include figures, store the image in the `/docs/assets/images/yyyymmdd/` folder and use the jekyll base.url reference as done in this template or see https://jekyllrb.com/docs/liquid/tags/#links. using the scale attribute , you can adjust the image size. --> <!-- Adjust the day, month --> # 29 APRIL 2021 ## INBO coding club <!-- Adjust the room number and name --> Exclusively on INBOflix --- class: center, middle # Welcome Raïsa  --- class: center, middle <!-- Create a new badge using Inkscape or other programs based on the assets/images/coding_club_badges.svg file -->  --- class: center, middle  [Download cheatsheet here](https://github.com/inbo/coding-club/blob/master/cheat_sheets/20181129_cheat_sheet_data_transformation.pdf) --- class: center, middle ### How to get started? Check the [Each session setup](https://inbo.github.io/coding-club/gettingstarted.html#each-session-setup) to get started. ### First time coding club? Check the [First time setup](https://inbo.github.io/coding-club/gettingstarted.html#first-time-setup) section to setup. --- class: left, middle ## Coding club tables **Like** a card club, we will split us in different tables (aka _breakout rooms_) and we will help each other! We return all together after a fixed amount of time to discuss each challenge apart. **Unlike** a card club, in our club there is no winner, neither within a table nor among tables!  --- class: center, middle ### Share your code during the coding session! <!-- Create a new hackmd file and replace this link (twice!) --> Go to https://hackmd.io/4h8gOw_jQquPNV2vXtt9xQ?both and start by adding your name in section "Participants". <iframe src="https://hackmd.io/4h8gOw_jQquPNV2vXtt9xQ?edit" height="400px" width="800px"></iframe> --- class: left, middle # Download data and code Today no R code script and only one data.frame to download You can download the material: - automatically via `inborutils::setup_codingclub_session()`* - manually** from GitHub folder [coding-club/data/20210429](https://github.com/inbo/coding-club/blob/master/data/20210429/) <br> <small> __\* Note__: you can use the date in "YYYYMMDD" format to download the coding club material of a specific day, e.g. run `setup_codingclub_session("20201027")` to download the coding club material of October, 27 2020. If date is omitted, the date of today is used. For all options, check the [tutorial online](https://inbo.github.io/tutorials/tutorials/r_setup_codingclub_session/).</small> <br> <small> __\*\* Note__: check the getting started instructions on [how to download a single file](https://inbo.github.io/coding-club/gettingstarted.html#each-session-setup)</small> --- class: left, middle Today we will work with aquatic trap data! Copy-paste the following code in a R script within your `coding-club` RStudio session and you can start with challenge 1. Happy coding. ```r library(tidyverse) # load aquatic trap data df <- read_csv("./data/20210429/20210429_aquatictrap_data.csv") ``` --- background-image: url(/assets/images/background_challenge_1.png) class: left, middle # Challenge 1 1. Display the columns `id` and `weight_total` 2. Display the distinct values of `location_id` and `location_name` 3. Display data where both `weight` and `weight_total` are missing 4. Order the rows by number of trapped individuals (`n_individuals`). How to order in increasing order? And in decreasing order? 4. Improve previous ordering by adding `date` as second variable (in case same number of individuals occurs). Order both variables in descending order 5. Display `id`, `species`, `n_individuals`, `weight` and `weight_total` for observations with non-empty values of `weight_total` --- class: left, middle # Intermezzo: the _pipe_ %>% From [dplyr documentation](https://dplyr.tidyverse.org/articles/dplyr.html?q=pipe#the-pipe):  --- background-image: url(/assets/images/background_challenge_2.png) class: left, middle # Challenge 2 We can now proceed by cleaning `df`. 1. Set `weight_total` equal to `weight` if empty, remove column `weight` and save as new object `df_cleaned` 2. Based on number of trapped individuals (`n_individuals`) and `weight_total`, calculate the average weight for each catch and set it in a new column of `df_cleaned` called `weight`. Put the columns `id`, `species`, `n_individuals`, `n_traps` and all ones starting with "weight" ahead 3. Improve location_name by applying these changes: original term | new term --- | --- `"Zandplaat Kastel"` | `"Kastel, zandplaat"` `"Antwerpen, Kennedytunnel"` | DO NOT CHANGE `"Grens Steendorp/Temse"` | `"Steendorp, grens met Temse"` --- background-image: url(/assets/images/background_challenge_3.png) class: left, middle # Challenge 3 1. For each combination of species and location, calculate the `weight_mean`, `depth_mean`, the `length_mean`, the minimum, the maximum and the total number of trapped individuals (`min_n`, `max_n`, `tot_n`), the date of the oldest and the most recent campaign (`first_deployment_date`, `last_deployment_date`) 2. How many measurement campaigns for each date-location? Select the top 10 3. For each location, calculate number of successful catches, `n_success`, (= `n_individuals` > 0 or `species` not `NA`) and number of species, `n_species` 4. Calculate the statistics in 1 only for locations with more than 5000 successful catches --- class: left, middle # dplyr: make hard things easy Do you want to calculate the _nonparametric bootstrap for obtaining confidence limits for the population mean without assuming normality_? :scream: With dplyr it's child's play! ```r > df_cleaned %>% group_by(species) %>% summarise(mean_cl_boot(length)) # A tibble: 44 x 4 species y ymin ymax <chr> <dbl> <dbl> <dbl> 1 baars 9.52 8.61 10.5 2 bittervoorn 5.23 4.75 5.66 3 blankvoorn 9.90 9.48 10.3 4 blauwbandgrondel 5.57 5.36 5.79 5 bot 7.46 7.28 7.63 6 brakwatergrondel 4.26 4.21 4.32 7 brasem 13.1 12.4 13.9 8 chinese_wolhandkrab NaN NA NA 9 dikkopje 4.90 4.78 5.02 10 driedoornige_stekelbaars 5.62 5.44 5.88 # ... with 34 more rows ``` --- class: center, middle # What do you think about breakout rooms?  --- class: left, middle ## Resources - R script with [challenge solutions](https://github.com/inbo/coding-club/blob/master/src/20210429/20210429_challenges_solutions.R) - [video recording](https://vimeo.com/544524895) (in **Dutch**) of this coding club has been published on the [INBO vimeo channel](https://vimeo.com/inbo)[video webinar] - [dplyr package documentation](https://dplyr.tidyverse.org/) - [dplyr cheat sheet](https://github.com/inbo/coding-club/blob/master/cheat_sheets/20181129_cheat_sheet_data_transformation.pdf) - extra challenges in [coding club of 28-01-2020](https://inbo.github.io/coding-club/sessions/20200128_data_exploration.html#1) --- class: center, middle  <!-- Adjust the room and date --> Room: 01.05 - Isala Van Diest(?)<br> Date: __25/05/2021__, van 10:00 tot 12:00<br> Subject: **the joy of data joining** <br> (registration announced via DG_useR@inbo.be)