class: center, middle  <!-- Do not forget to adapt the presentation title in the header! --> <!-- Adjust the presentation to the session. Focus on the challenges, this is not a coding tutorial. Note, to include figures, store the image in the `/docs/assets/images/yyyymmdd/` folder and use the jekyll base.url reference as done in this template or see https://jekyllrb.com/docs/liquid/tags/#links. using the scale attribute , you can adjust the image size. --> <!-- Adjust the day, month --> # 24 JUNE 2021 ## INBO coding club <!-- Adjust the room number and name --> Exclusively on INBOflix --- class: center, middle <!-- Create a new badge using Inkscape or other programs based on the assets/images/coding_club_badges.svg file -->  --- class: left, middle # Introduction: what's a function (in R)? .center[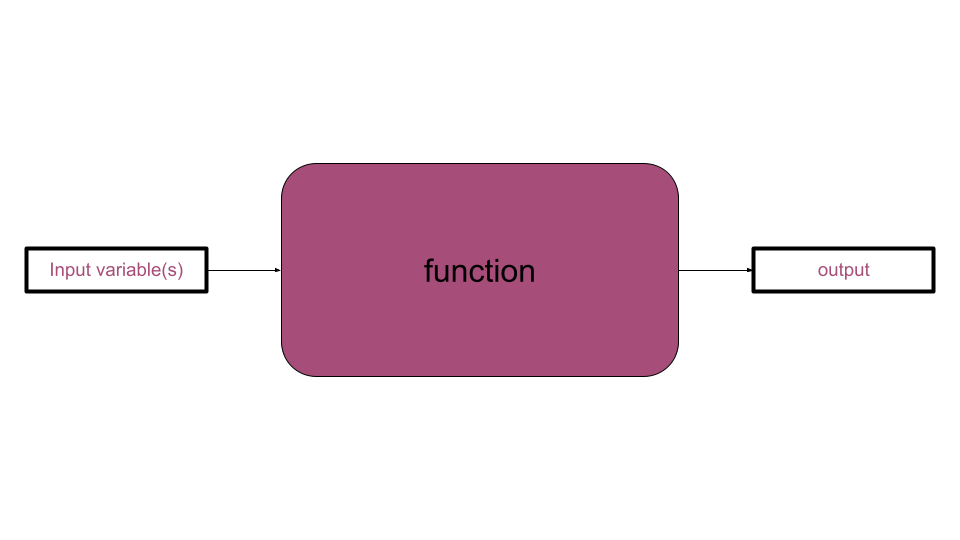] ```r # create your function my_function <- function(var1) { # "do something" with var1 to generate an output return(output) } # use your function as many times as you want input1 <- 5 my_value1 <- my_function(input1) input2 <- 6 my_value2 <- my_function(input2) ``` --- class: left, middle # Introduction: When do we ABSOLUTELY need functions? If both these conditions are true: - you have to `"do something"` longer than one line of code - you need to `"do something"` at least for two different inputs --- class: left, top # Introduction: When SHOULD we use functions? - the "do something" is actually a workflow: split it in (small) functions - the "do something" is very short (e.g. a one-line formula) but often used: putting it in a function will give it an understandable name and will avoid typos .center[ ] --- class: left, top # Introduction: good names Functions are the building blocks of your data analysis: give your functions understandable and short enough names. It's better for you, it's better for everybody. .center[ ] --- class: left, top # Introduction: output of R functions Can a R function return multiple outputs? NO. R functions return only **one output**: `return(my_output)` But you can put your outputs (e.g. a data.frame and a plot) in a list. A named list will make the future-you and any other using the function very happy: documentation begins by coding with style :-) ```r library(tidyverse) my_summary_function <- function(df, x_colname, y_colname) { df_prev <- head(df) point_overview <- ggplot(df) + geom_point(aes(!!sym(x_colname), !!sym(y_colname))) return(list(df_preview = df_prev, plot_overview = point_overview)) } overview_mtcars_mpg_disp <- my_summary_function(df = mtcars, x_colname = "mpg", y_colname = "disp") overview_mtcars_mpg_disp$df_preview overview_mtcars_mpg_disp$plot_overview ``` --- class: center, top ### How to get started? Check the [Each session setup](https://inbo.github.io/coding-club/gettingstarted.html#each-session-setup) to get started. ### First time coding club? Check the [First time setup](https://inbo.github.io/coding-club/gettingstarted.html#first-time-setup) section to setup. --- class: left, top ## Coding club play tables **Like** a card club, we will split us in different tables (aka _breakout rooms_) and we will help each other! We return all together after a fixed amount of time to discuss each challenge apart. **Unlike** a card club, in our club there is no winner, neither within a table nor among tables!  --- class: center, middle # Share your code during the coding session <!-- Create a new hackmd file and replace this link (twice!) --> Go to https://hackmd.io/HoRyIsrqR9-uAGoGGDKbVA?both and start by adding your name in section "Participants". <iframe src="https://hackmd.io/HoRyIsrqR9-uAGoGGDKbVA?edit" height="400px" width="800px"></iframe> --- class: left, top # Download data and code You can download the material of today: - automatically via `inborutils::setup_codingclub_session()`* - manually** from GitHub folders [coding-club/data/20210624](https://github.com/inbo/coding-club/tree/master/data/20210624) and [coding-club/src/20210624](https://github.com/inbo/coding-club/tree/master/src/20210624) <br> <small> __\* Note__: you can use the date in "YYYYMMDD" format to download the coding club material of a specific day, e.g. run `setup_codingclub_session("20201027")` to download the coding club material of October, 27 2020. If date is omitted, the date of today is used. For all options, check the [tutorial online](https://inbo.github.io/tutorials/tutorials/r_setup_codingclub_session/).</small> <br> <small> __\*\* Note__: check the getting started instructions on [how to download a single file](https://inbo.github.io/coding-club/gettingstarted.html#each-session-setup)</small> --- class: left, top # Load libraries and data ```r library(tidyverse) library(tidylog) # not mandatory, just I find it useful library(sf) library(leaflet) library(htmltools) ``` --- class: left, top # The data world of Mrs. Z Today you play the role of a researcher, Mrs Z. She received in January 2011 observations of the asian ladybeetle (_Harmonia axyridis_) collected in the surroundings of Antwerp by a contractor. These observations are stored in [20210624_harmonia_axyridis_2010.txt](https://github.com/inbo/coding-club/blob/master/data/20210624/20210624_harmonia_axyridis_2010.txt). She wrote some code to read, analyze and visualize these obsevations. You can find the code in [20210624_challenges.R](https://github.com/inbo/coding-club/blob/master/src/20210624/20210624_challenges.R). She uses a geopacakge shapefile, [20210624_eea_1x1km_grid_BE.gpkg](https://github.com/inbo/coding-club/blob/master/data/20210624/20210624_eea_1x1km_grid_BE.gpkg), containing the official [Belgian 1x1km square grid](https://www.eea.europa.eu/data-and-maps/data/eea-reference-grids-2), as provided by the [European Environment Agency](https://www.eea.europa.eu/), useful to group observations in a grid. What it seemed to be a one -shot anlysis, becomes very soon something more: she receives a similar file from another contractor containing observations of the bow-winged grasshopper (_Chorthippus biguttulus_) collected in the same area: [20210624_chorthippus_biguttulus_2010.txt](https://github.com/inbo/coding-club/blob/master/data/20210624/20210624_chorthippus_biguttulus_2010.txt). Important: the columns containing the coordinates are called differently. She also get to know that she will have to redo the same analysis the next years, at least on observations of the Asian ladybeetle: - [20210624_harmonia_axyridis_2011.txt](https://github.com/inbo/coding-club/blob/master/data/20210624/20210624_harmonia_axyridis_2011.txt) - [20210624_harmonia_axyridis_2012.txt](https://github.com/inbo/coding-club/blob/master/data/20210624/20210624_harmonia_axyridis_2012.txt) I think you can find yourself in the role of Mrs Z in this Oscar awarded movie. Before starting, a best practice reminder: write the functions in a separate file. You can call it `20210624_functions.R`. You can use your functions in the challenge file by first _sourcing_ this file, e.g. `source("./src/20210624/20210624_functions.R")`. --- background-image: url(/assets/images/background_challenge_1.png) class: left, top # Challenge 1 1. It's January 2011. After getting the observations of Harmonia axyridis, you get now observations of Chorthippus biguttulus. Write a function called `get_obs_2010()` which takes as argument a species (e.g. "Harmonia axyridis") and returns the observations of 2010 as a data.frame 2. It's January 2012. Mrs Z got observations of Harmonia axyridis collected in 2011. How does she read these data? Does she create a new function, `get_obs_2011()` or does she best change the function she wrote one year before by renaming it `get_obs()` and adding `year` as extra argument? --- background-image: url(/assets/images/background_challenge_2.png) class: left, top # Challenge 2 part 1 1. Write a function called `clean_data()` to handle step 2 and return the cleaned data.frame without suspected or not enough precise observations. Input arguments: - `df` data.frame with observations - `max_coord_uncertain`: maximum of `coordinateUncertaintyInMeters` (numeric), deafult value as in script - `issues_to_discard` (character vector), default value as in script - `occurrenceStatus_to_discard` (character vector), default value as in script 2. Write a function called `assign_eea_cell()` to handle step 3. Return a `df` as output, with two extra columns: `geometry` and `eea_cell_code`, the last one containing the EEA cell code each observation belongs to. Input argument: - `df` data.frame with observations - `longitude_colname`: character, name of the column with longitude values* - `latitude_colname`: character, name of the column with latitude values* <br> <small> __\* Note__: `!!sym()` can help you to use the longitude/latitude colnames in the `mutate()` step</small> --- background-image: url(/assets/images/background_challenge_2.png) class: left, top # Challenge 2 part 2 3. Although short, step 4 should be put in a function apart, instead of being part of the previous function. Do you agree? Why? If you agree, put it in a function called `get_n_obs_per_cell()` 4. Write a function for step 5. Would you read the shapefile with the EEA grid of Belgium in the function or outside the function? up to you to find a good name to the function :-) --- class: left, top # Intermezzo: what happens in the function stays in the function! Not in R unfortunately... If you use a variable in a function (`c` in the example below) which is not defined as argument, but it is defined outside the function, R doesn't throw any error, as many other programming languages do! ```r c <- 3 tricky_function <- function(a, b) { sum <- a + b + c # c is not defined as argument! Sitll, the function works... return(sum) } tricky_function(1, 2) #> [1] 6 tricky_function(5, 6) #> [1] 14 tricky_function(10, 20) #> [1] 33 ``` Still, it's bad practice as it can end up in wrong results. Better an error than a wrong result! Be careful. --- background-image: url(/assets/images/background_challenge_3.png) class: left, top # Challenge 3 1. We are almost there. Adapt the last part of the code to be able to personalize the interactive leaflet. Write a function called `visualize_obs_cells()`, which should allow the user to make leaflet maps for any `species` and any `year`. Allow the user also to specify his/her own color palette (`pal`) and the filling color opacity of the cells. You can use the values in the code as default values. Test the function providing other input values. 2. Now that we have all blocks, what do you think to automatize the entire workflow by creating a function called `make_report()`? Think about which arguments you need as input. Return a list containing: - the data.frame returned by step 4 - the leaflet map --- class: center, middle # Did you write a function useful for yourself and your colleagues? Share it by adding it to [`inborutils`](https://github.com/inbo/inborutils) package. 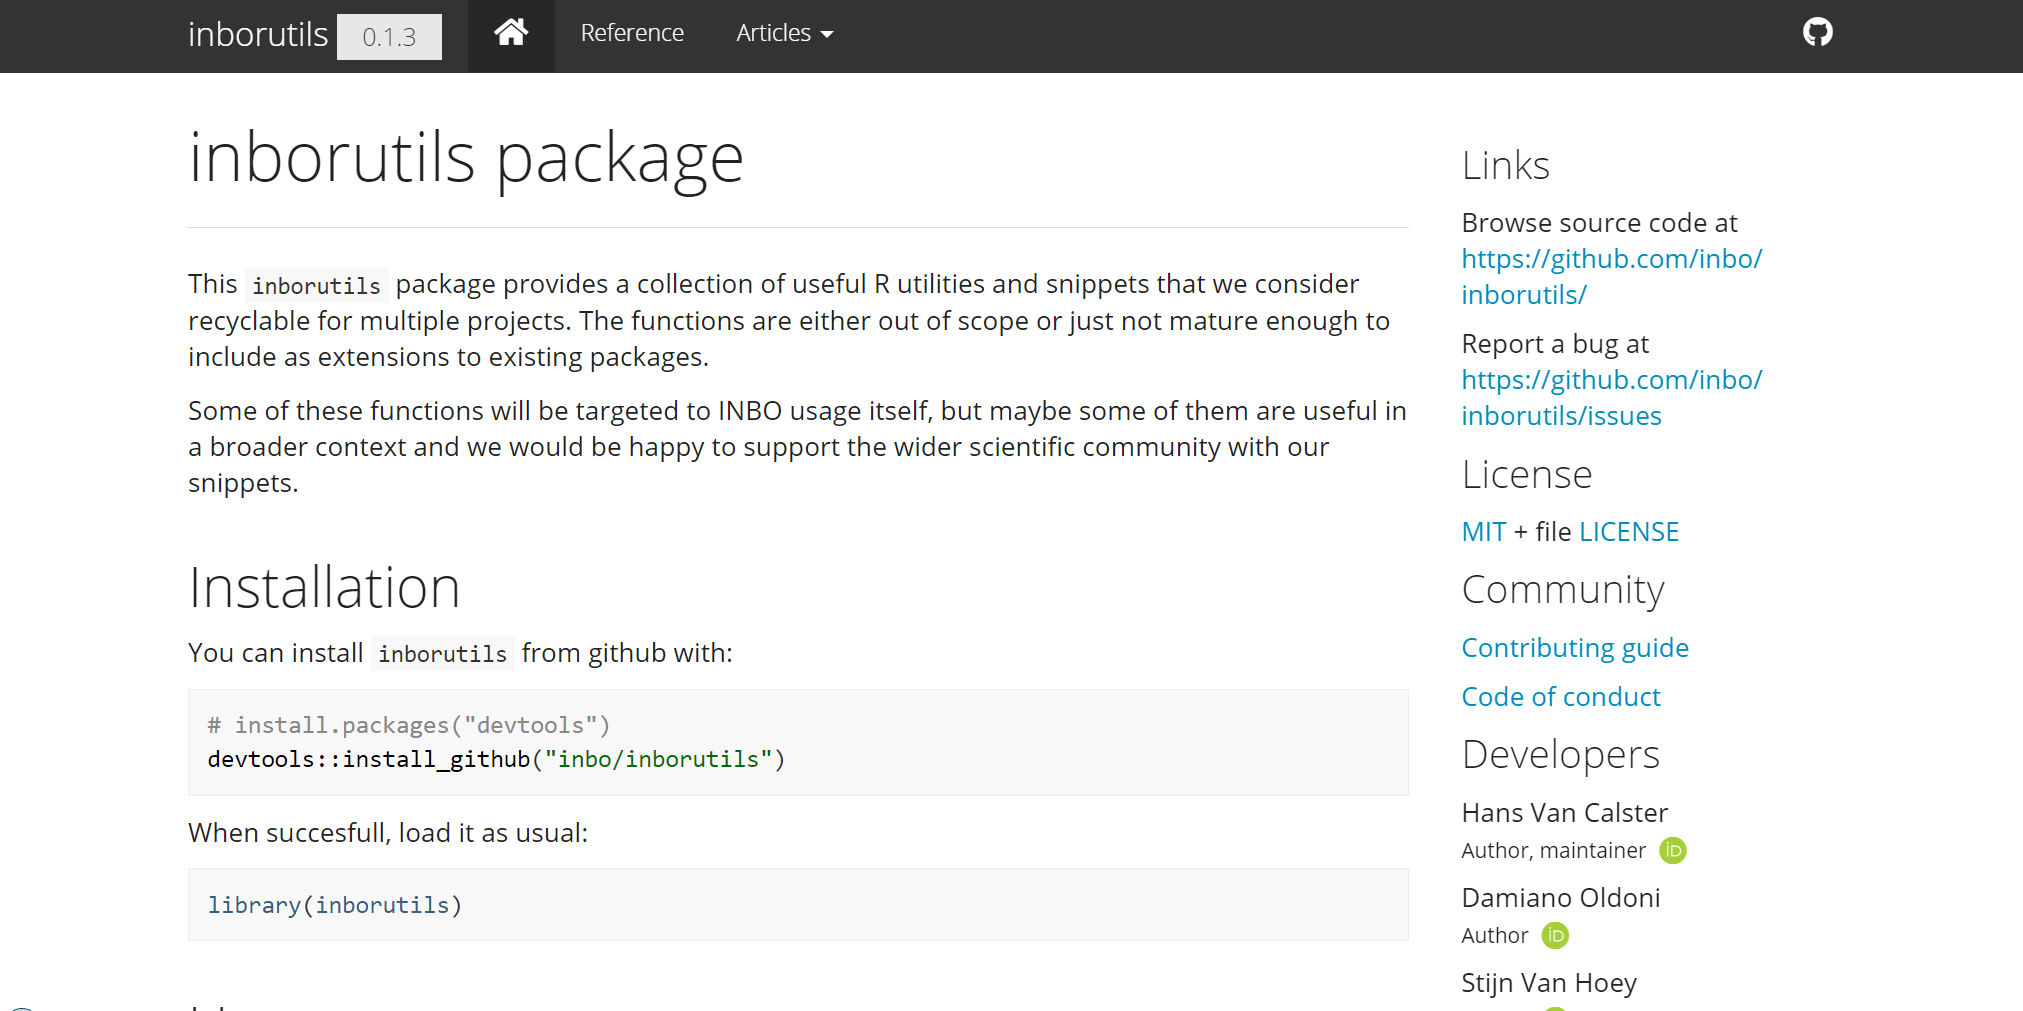 --- class:left, top # Do you want more? Get a more [formal framework](https://www.stat.berkeley.edu/~statcur/Workshop2/Presentations/functions.pdf), go [in depth](http://adv-r.had.co.nz/Functions.html#function-arguments), do a check [under the hood](https://swcarpentry.github.io/r-novice-inflammation/14-supp-call-stack/) or learn more about [programming with `dplyr`](https://dplyr.tidyverse.org/articles/programming.html). .center[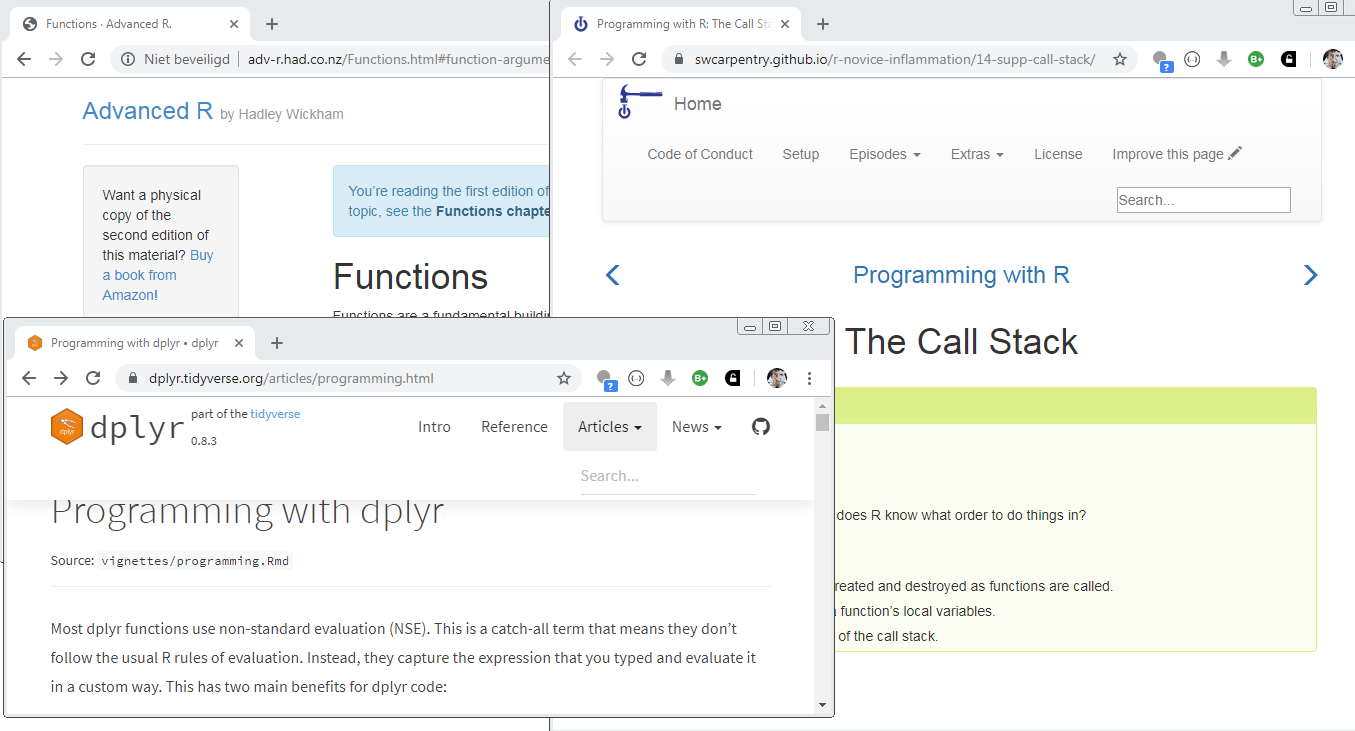 ] Solutions: [20210624_challenges_solutions.R](https://github.com/inbo/coding-club/blob/master/src/20210624/20210624_challenges_solutions.R) and [20210624_functions_solutions.R](https://github.com/inbo/coding-club/blob/master/src/20210624/20210624_functions_solutions.R) [Video recording](https://vimeo.com/567520656) of this coding club edition is available on the [INBO vimeo channel](https://vimeo.com/inbo) More challenges? Check the [coding club session](https://inbo.github.io/coding-club/sessions/20190924_make_your_code_functional_use_functions.html) of 24-09-2019. Have fun! --- class:center, middle # Summer break July = summer = no INBO coding club ```r library(cowsay) cowsay::say(what = "Enjoy the summeR!", by = "egret", what_color = c("red", "orange", "green", "blue", "purple")) ```  --- class: center, middle  <!-- Adjust the room and date --> Room: 01.05 - Isala Van Diest<br> Date: __31/08/2021__, van 10:00 tot 12:00<br> Subject: **ggplot basics** <br> (registration announced via DG_useR@inbo.be)