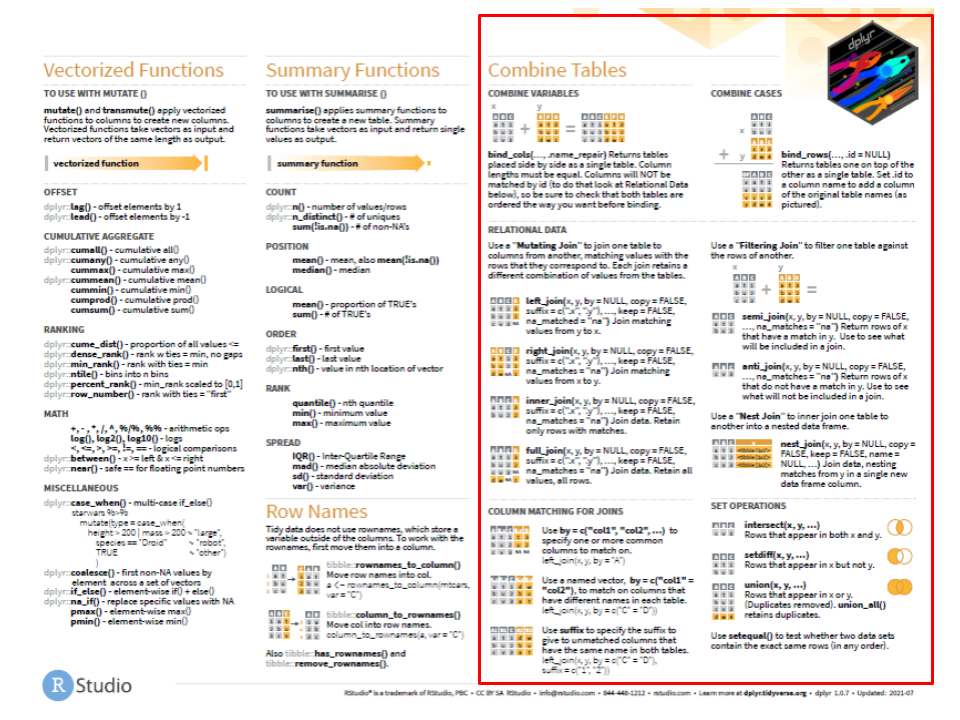
class: center, middle  <!-- Do not forget to adapt the presentation title in the header! --> <!-- Adjust the presentation to the session. Focus on the challenges, this is not a coding tutorial. Note, to include figures, store the image in the `/docs/assets/images/yyyymmdd/` folder and use the jekyll base.url reference as done in this template or see https://jekyllrb.com/docs/liquid/tags/#links. using the scale attribute , you can adjust the image size. --> <!-- Adjust the day, month --> # 31 MAY 2021 ## INBO coding club <!-- Adjust the room number and name --> Online due to strike at public transport --- class: center, middle <!-- Create a new badge using Inkscape or other programs based on the assets/images/coding_club_badges.svg file -->  --- class: center, middle  [Download cheatsheet here](https://github.com/inbo/coding-club/blob/master/cheat_sheets/20220428_cheat_sheet_data_transformation.pdf) --- class: center, middle ### How to get started? Check the [Each session setup](https://inbo.github.io/coding-club/gettingstarted.html#each-session-setup) to get started. ### First time coding club? Check the [First time setup](https://inbo.github.io/coding-club/gettingstarted.html#first-time-setup) section to setup. --- class: left, top  <br> No yellow sticky notes online. We use hackmd (see next slide) but basic principle doesn't change. --- class: center, middle ### Share your code during the coding session! <!-- Create a new hackmd file and replace this link (twice!) --> Go to https://hackmd.io/a-J196OqTX-hqaHMyWanlA?both and start by adding your name in section "Participants". <iframe src="https://hackmd.io/a-J196OqTX-hqaHMyWanlA?edit" height="400px" width="800px"></iframe> --- class: left, middle # Download data and code We've put all dataframes in a unique `.Rda` file You can download the material: - automatically via `inborutils::setup_codingclub_session()`* - manually** from GitHub folder [coding-club/data/20220531](https://github.com/inbo/coding-club/blob/master/data/20220531/) <br> <small> __\* Note__: you can use the date in "YYYYMMDD" format to download the coding club material of a specific day, e.g. run `setup_codingclub_session("20201027")` to download the coding club material of October, 27 2020. If date is omitted, the date of today is used. For all options, check the [tutorial online](https://inbo.github.io/tutorials/tutorials/r_setup_codingclub_session/).</small> <br> <small> __\*\* Note__: check the getting started instructions on [how to download a single file](https://inbo.github.io/coding-club/gettingstarted.html#each-session-setup)</small> --- class: left, middle # Load libraries and data The R package [`tidylog`](https://github.com/elbersb/tidylog#tidylog) can be very helpful as it provides feedback about dplyr and tidyr operations. ```r install.packages("tidylog") library(tidyverse) library(tidylog) ``` --- class: left, middle # Data description Partridge data is inspired by the [yearly partridge counting](https://www.natuurenbos.be/patrijs) that is done from January 15th untill March 31st. Each game management unit (wildbeheerseenheid, WBE) is required to count partridges in their territory if they want to hunt partridge. There are two dataframes: - `partridge`: a dataset with observations of birds. This includes the date of the observation, the fieldworker who submitted the observation, the type of observation (couple, single, group, or only noise), and location (WBE number and x & y). - `WBE`: for each game management unit (WBE), this dataframe containse the unique identification number (wbe number), name, province, and surface area. GBIF butterfly checklist data, inspired by Dirk's [Eurobutt checklist](https://www.gbif.org/dataset/f9af6ffd-febc-4626-b2e8-809b1c60fa01#description). - `taxon`: dataframe with taxonomic information of butterflies found in West-Europe. Each butterfly has a unique identifier (column `id`) - `vernacularname`: vernacular names in English. Link to `taxon` in column `taxon_id` - `distribution_BE`, `distribution_NL`, `distribution_LU` : data.frames about distribution and threat status of butterflies in Belgium (BE), the Netherlands (NL) and Luxembourg (LU). Link to `taxon` in column `taxon_id` --- background-image: url(/assets/images/background_challenge_1.png) class: left, middle # Challenge 1 1. Make an overview of the number of observations in each WBE and call it *table1* (recap of last class; use group_by and summarize). 2. Add province, WBE name, and surface area to *table1* (where available)? 3. How are the columns ordered? Are the columns of *table1* on the left? Try to get the same result but putting them on the right. 4. Some observations have a missing value for column `wbe` and some WBE did not count at all. Join both *table1* and *WBE* and retain only WBE who are part of both. 5. How to invert the order of the columns? 6. Now, join both again but retain ALL EXISTING WBE. use the dplyr function `replace_na` to show a zero for those WBE that have not observed any partridges. --- class: left, middle # Intermezzo: combine variables vs cases In number 5 of the 1st challenge, we not only add columns (_variables_), but also rows (_cases_). Why can't we do this using functions which combine rows?  --- background-image: url(/assets/images/background_challenge_2.png) class: left, middle # Challenge 2 1. Distributions from Belgium, Netherlands and Luxembourg should not overlap. How can you check it? There are several ways to do it, but try to use a data joining technique, which is likely the shortest and more readable way 2. Merge the three `distribution_*` dataframes into a data.frame called `distribution` 3. Check that all taxa in `vernacularname` point to taxa in `taxon` 4. Which taxa in `taxon` do not have vernacular names? --- background-image: url(/assets/images/background_challenge_3.png) class: left, middle # Challenge 3 1. Add `vernacularname` information to `taxon`. Save the result as a new df called `extended_taxon`. What happens to columns with the same name? Distinguish them by adding suffix "_taxon" to the column(s) from `taxon`, and "_distribution" to the column(s) from `distribution`. 2. Add `distribution` to `extended_taxon` and retain only the taxa found in Belgium, Netherlands or Luxembourg, i.e. only taxa in `distribution` 3. Dirk points to East, he wants to include butterfly data from the Balcans. His dear Albanian colleagues send him an Albanian national list based on the same format as the Belgian/Dutch/Luxembourg ones. He got three files: `taxon_AL`, `distribution_AL` and `vernacularname_AL`. Which species are found only in Albania? And which one in West Europe (`taxon`) but not in Albania? 4. Which species are found both in Albania (`taxon_AL`) and in West-Europe? 5. Help him to merge `taxon_AL`, `distribution_AL` and `vernacularname_AL` to `taxon`, `distribution` and `vernacularname` respecitvely --- class: left, middle ## Resources - [Challenge solutions](https://github.com/inbo/coding-club/blob/master/src/20220531/20220531_challenges_solutions.R) available - [dplyr package documentation](https://dplyr.tidyverse.org/) - [dplyr cheat sheet](https://github.com/inbo/coding-club/blob/master/cheat_sheets/20220428_cheat_sheet_data_transformation.pdf) - [tidylog package](https://github.com/elbersb/tidylog#tidylog) on GitHub - [tutorial on joining with dplyr](https://dplyr.tidyverse.org/articles/two-table.html) - [stats 545 on multiple tibbles](https://stat545.com/multiple-tibbles.html) - [R for Data Science on relational data](https://r4ds.had.co.nz/relational-data.html#relational-data) --- class: center, middle  <!-- Adjust the room and date --> Room: 01.05 - Isala Van Diest<br> Date: __30/06/2021__, van 10:00 tot 12:30<br> Subject: **functions in R** <br> (registration announced via DG_useR@inbo.be)