class: center, middle  <!-- Do not forget to adapt the presentation title in the header! --> <!-- Adjust the presentation to the session. Focus on the challenges, this is not a coding tutorial. Note, to include figures, store the image in the `/docs/assets/images/yyyymmdd/` folder and use the jekyll base.url reference as done in this template or see https://jekyllrb.com/docs/liquid/tags/#links. using the scale attribute , you can adjust the image size. --> <!-- Adjust the day, month --> # 30 JUNE 2022 ## INBO coding club <!-- Adjust the room number and name --> Herman Teirlinck Building 01.05 - Isala Van Diest --- class: center, middle <!-- Create a new badge using Inkscape or other programs based on the assets/images/coding_club_badges.svg file -->  --- class: left, middle # Introduction: a function (in R) .center[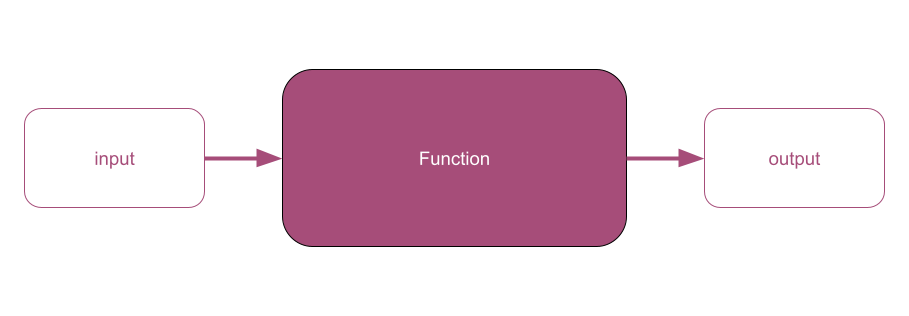] ```r my_function <- function(var1) { # "do something" with var1 to generate an `output` # example: var1 is a vector of numbers. # Return the even numbers out of var1 output <- var1[var1 %%2 == 0] return(output) } # use your function as many times as you want input1 <- c(2, 5, 15) my_value1 <- my_function(input1) my_value1 input2 <- c(1, 6, 9, 10, 12, 21) my_value2 <- my_function(input2) my_value2 ``` --- class: left, middle # Introduction: When do we ABSOLUTELY need functions? If both these conditions are true: - you have to `"do something"` longer than one line of code - you need to `"do something"` at least for two different inputs --- class: left, top # Introduction: When SHOULD we use functions? - the "do something" is actually a workflow: split it in (small) functions - the "do something" is very short (e.g. a one-line formula) but often used: putting it in a function will give it an understandable name and will avoid typos .center[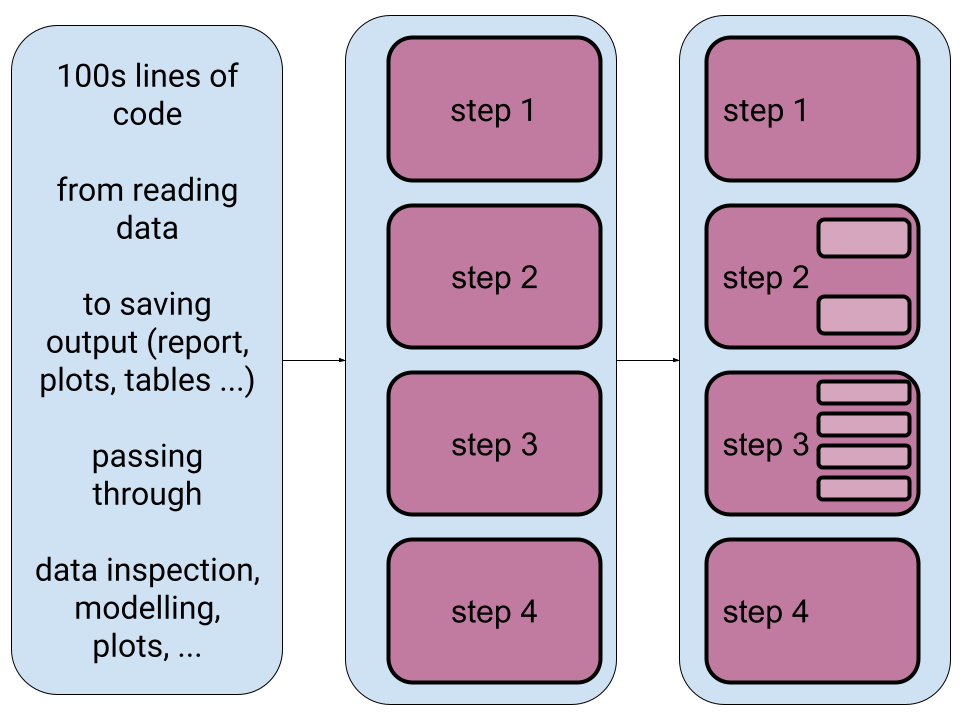 ] --- class: left, top # Introduction: good names Functions are the building blocks of your data analysis: give your functions understandable and short enough names. It's better for future-you, it's better for everybody. .center[ ] --- class: left, top # Introduction: output of R functions Can a R function return multiple outputs? NO. R functions return only **one output**: `return(my_output)` But you can put your outputs (e.g. a data.frame and a plot) in a list. A named list will make the future-you and any other using the function very happy: documentation begins by naming things :-) ```r library(tidyverse) my_summary_function <- function(df, x_colname, y_colname) { df_prev <- head(df) point_overview <- ggplot(df) + geom_point(aes(!!sym(x_colname), !!sym(y_colname))) return(list(df_preview = df_prev, plot_overview = point_overview)) } overview_mtcars_mpg_disp <- my_summary_function(df = mtcars, x_colname = "mpg", y_colname = "disp") overview_mtcars_mpg_disp$df_preview overview_mtcars_mpg_disp$plot_overview ``` --- class: center, top ### How to get started? Check the [Each session setup](https://inbo.github.io/coding-club/gettingstarted.html#each-session-setup) to get started. ### First time coding club? Check the [First time setup](https://inbo.github.io/coding-club/gettingstarted.html#first-time-setup) section to setup. --- class: left, top  --- class: center, middle # Share your code during the coding session <!-- Create a new hackmd file and replace this link (twice!) --> Go to https://hackmd.io/eweGY1PnSFiULmBskYMyow?both and start by adding your name in section "Participants". <iframe src="https://hackmd.io/eweGY1PnSFiULmBskYMyow?edit" height="400px" width="800px"></iframe> --- class: left, top # Download data and code You can download the material of today: - automatically via `inborutils::setup_codingclub_session()`* - manually** from GitHub folders [coding-club/data/20220630](https://github.com/inbo/coding-club/tree/master/data/20220630) and [coding-club/src/20220630](https://github.com/inbo/coding-club/tree/master/src/20220630) <br> <small> __\* Note__: you can use the date in "YYYYMMDD" format to download the coding club material of a specific day, e.g. run `setup_codingclub_session("20201027")` to download the coding club material of October, 27 2020. If date is omitted, the date of today is used. For all options, check the [tutorial online](https://inbo.github.io/tutorials/tutorials/r_setup_codingclub_session/).</small> <br> <small> __\*\* Note__: check the getting started instructions on [how to download a single file](https://inbo.github.io/coding-club/gettingstarted.html#each-session-setup)</small> --- class: left, top # Load libraries and data ```r library(tidyverse) library(sf) library(leaflet) library(htmltools) ``` --- class: left, top .center[] # The data world of doctor Z Today you play the role of a researcher, dr Z. She received in January 2011 observations of the asian ladybeetle (_Harmonia axyridis_) collected in the surroundings of Antwerp by a contractor. These observations are stored in [20220630_harmonia_axyridis_2010.txt](https://github.com/inbo/coding-club/blob/master/data/20220630/20220630_harmonia_axyridis_2010.txt). She wrote some code to read, analyze and visualize these obsevations. You can find the code in [20220630_challenges.R](https://github.com/inbo/coding-club/blob/master/src/20220630/20220630_challenges.R). She uses a geopackage shapefile, [20220630_eea_1x1km_grid_BE.gpkg](https://github.com/inbo/coding-club/blob/master/data/20220630/20220630_eea_1x1km_grid_BE.gpkg), containing the official [Belgian 1x1km square grid](https://www.eea.europa.eu/data-and-maps/data/eea-reference-grids-2), as provided by the [European Environment Agency](https://www.eea.europa.eu/), useful to group observations in a grid. What seemed to be a one-shot anlysis, becomes very soon something more: she receives a similar file from another contractor containing observations of the bow-winged grasshopper (_Chorthippus biguttulus_) collected in the same area: [20220630_chorthippus_biguttulus_2010.txt](https://github.com/inbo/coding-club/blob/master/data/20220630/20220630_chorthippus_biguttulus_2010.txt). Important: the columns containing the coordinates are called differently. --- class: left, top .center[] # The data world of doctor Z She also learns that she will have to redo the same analysis in the future, for sure on observations of the Asian ladybeetle: - [20220630_harmonia_axyridis_2011.txt](https://github.com/inbo/coding-club/blob/master/data/20220630/20220630_harmonia_axyridis_2011.txt) - [20220630_harmonia_axyridis_2012.txt](https://github.com/inbo/coding-club/blob/master/data/20220630/20220630_harmonia_axyridis_2012.txt) And, she is afraid, new data of bow-winged grasshopper will find her sooner or later. I think you can find yourself in the role of dr Z in this Oscar awarded movie. Before starting, a best practice reminder: write the functions in a *separate file*. You can call it `20220630_functions.R`. You can use your functions in the challenge file by first *sourcing* this file, e.g. `source("./src/20220630/20220630_functions.R")`. --- background-image: url(/assets/images/background_challenge_1.png) class: left, top # Challenge 1 1. It's January 2011. After getting the observations of Harmonia axyridis, you get now observations of Chorthippus biguttulus. Write a function called `get_obs_2010()` which takes as argument a species (e.g. `"Harmonia axyridis"`) and returns the observations of 2010 as a data.frame 2. It's January 2012. dr Z got observations of Harmonia axyridis collected in 2011. She is wise so she is going to change the function she wrote the year before by renaming it `get_obs()` and adding `year` as extra argument. How does she proceed? --- class: left, top # Intermezzo 1: what happens in the function stays in the function! Unfortunately not in R :-/ ```r c <- 3 tricky_function <- function(a, b) { # `c` is not defined as argument! Sitll, the function works... sum <- a + b + c return(sum) } tricky_function(1, 2) #> [1] 6 tricky_function(5, 6) #> [1] 14 tricky_function(10, 20) #> [1] 33 ``` Even if it works what you see above is (very) **bad** practice as it can end up in wrong results. Better an error than a wrong result, right? So, please be careful! --- background-image: url(/assets/images/background_challenge_2.png) class: left, top # Challenge 2 - part 1 1. Write a function called `clean_data()` to handle step 2 and return the cleaned data.frame without suspected or not enough precise observations. Input arguments: - `df`: data.frame with observations - `max_coord_uncertain`: maximum of `coordinateUncertaintyInMeters` (numeric), deafult value as in script. - `issues_to_discard`: issues whose obs have to be filtered out (character vector), default value as in script. - `occurrenceStatus_to_discard`: the `occurrenceStatus` values whose obs have to be filtered out (character vector), default value as in script. 2. Write a function called `assign_eea_cell()` to handle step 3. Return a `df` as output, with two extra columns: `geometry` and `eea_cell_code`, the last one containing the EEA cell code each observation belongs to. Input argument: - `df`: data.frame with observations. - `longitude_colname`: character, name of the column with longitude values*. - `latitude_colname`: character, name of the column with latitude values*. <br> <small> __\* Note__: `!!sym()` can help you to use the longitude/latitude colnames in the `mutate()` step</small> --- background-image: url(/assets/images/background_challenge_2.png) class: left, top # Challenge 2 - part 2 3. Although short, step 4 should be put in a function apart, instead of being part of the previous function. Do you agree? Why? If you agree, put it in a function called `get_n_obs_per_cell()` 4. Write a function for step 5. Would you read the shapefile with the EEA grid of Belgium in the function or outside the function? Up to you to find a good name to this function :-) --- class: left, top # Intermezzo 2: document your functions with style C. Bukowski once wrote that [_"Style is the answer to everything"_](https://www.elyrics.net/read/c/charles-bukowski-lyrics/style-lyrics.html). If not really everything, it's often more than just a nice-to-have feature. Function documentation is essential while using R. How many times did you use the help (`?function_name`) in your daily woRk? Documenting your functions can be done with style by following the [Roxygen](https://roxygen2.r-lib.org/index.html) conventions as programmers writing functions for R packages do. Again, future-you and your colleagues will praise you. Do you know you can use the [`docstring`](https://github.com/dasonk/docstring) package to create help pages of your functions even if they are not in a package? Speaking about style, we, at INBO, follow the official and very stylish [INBO Styleguide for R code](https://inbo.github.io/tutorials/tutorials/styleguide_r_code/). --- class: left, top # Intermezzo 2: document your functions with style ```r install.packages("docstring") library(docstring) remove_uneven <- function(numvec) { #' Filter uneven values out #' #' Function to remove uneven values from a numeric vector. #' #' @param numvec Numeric vector. Length can be variable. #' #' @return Numeric vector containing only the even numbers in `numvec`. #' #' @examples #' numbers <- 1:10 #' remove_uneven(numbers) #' #' # if an empty vector is given, an empty vector is returned #' remove_uneven(numeric(0)) output <- numvec[numvec %%2 == 0] return(output) } ``` --- class: left, top # Intermezzo 2: document your functions with style ```r docstring(remove_uneven) # or just ?remove_uneven ```  --- background-image: url(/assets/images/background_challenge_3.png) class: left, top # Challenge 3 We are almost there. Adapt the last step (step 6) to be able to personalize the interactive leaflet. Write a function called `visualize_obs_cells()`, to allow the user to make leaflet maps for any `species` and any `year`. Allow the user also to specify his/her own color palette (`pal`) and the filling color opacity of the cells. You can use the values in the code as default values. Test the function with other input values. --- class: left, top # Bonus challenge Now that we have all blocks, automatize the entire workflow by creating a macrofunction called `make_report()` embedding all steps developed in the previous challenges. Think about which arguments you need as input. Return a named list containing: - the data.frame returned by step 4 - the leaflet map --- class: center, middle # Did you write a function useful for yourself and your colleagues? Share it by adding it to [`inborutils`](https://github.com/inbo/inborutils) package. 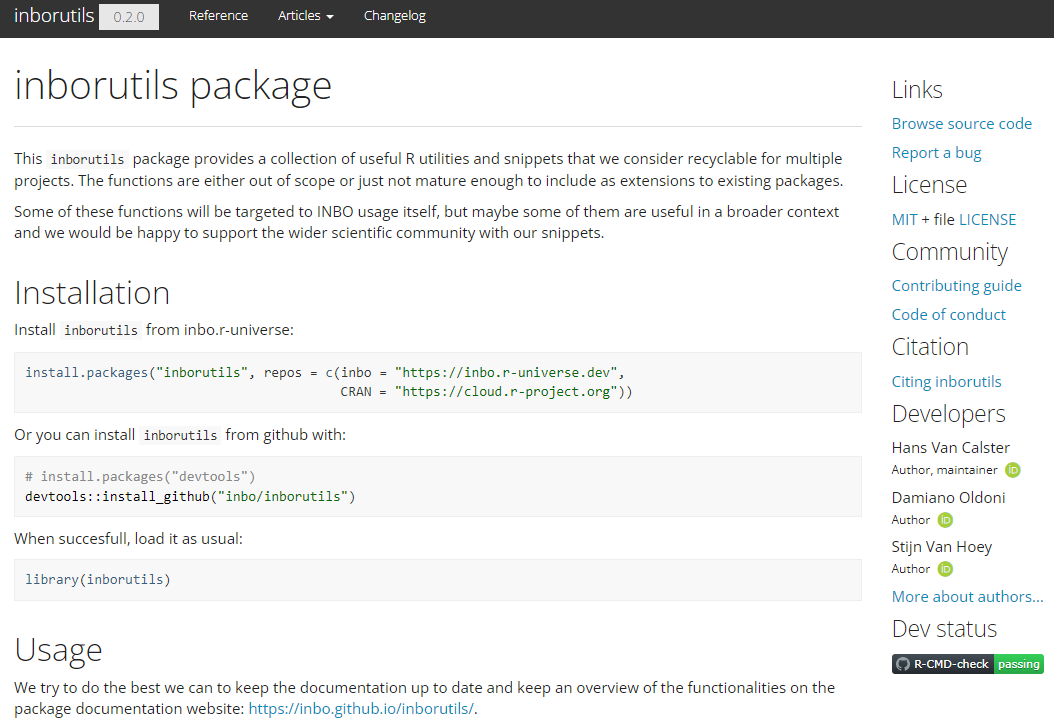 --- class:left, top # Resources - [Challenges solutions](https://github.com/inbo/coding-club/blob/master/src/20220630/20220630_challenges_solutions.R) and corresponding [functions](https://github.com/inbo/coding-club/blob/master/src/20220630/20220630_functions_solutions.R) are available - [Video recording](https://vimeo.com/737814426) is available at the INBO coding club channel - Do you want to learn more about functions? Get a more [formal framework](https://www.stat.berkeley.edu/~statcur/Workshop2/Presentations/functions.pdf), go [in depth](http://adv-r.had.co.nz/Functions.html#function-arguments), do a check [under the hood](https://swcarpentry.github.io/r-novice-inflammation/14-supp-call-stack/) or learn more about [programming with `dplyr`](https://dplyr.tidyverse.org/articles/programming.html). - The [INBO styleguide for R code](https://inbo.github.io/tutorials/tutorials/styleguide_r_code/). - Some advices from [tidyverse style guide](https://style.tidyverse.org/documentation.html) can also be useful. - Packages [ROxygen2](https://roxygen2.r-lib.org/index.html) and [docstring](https://github.com/dasonk/docstring). .center[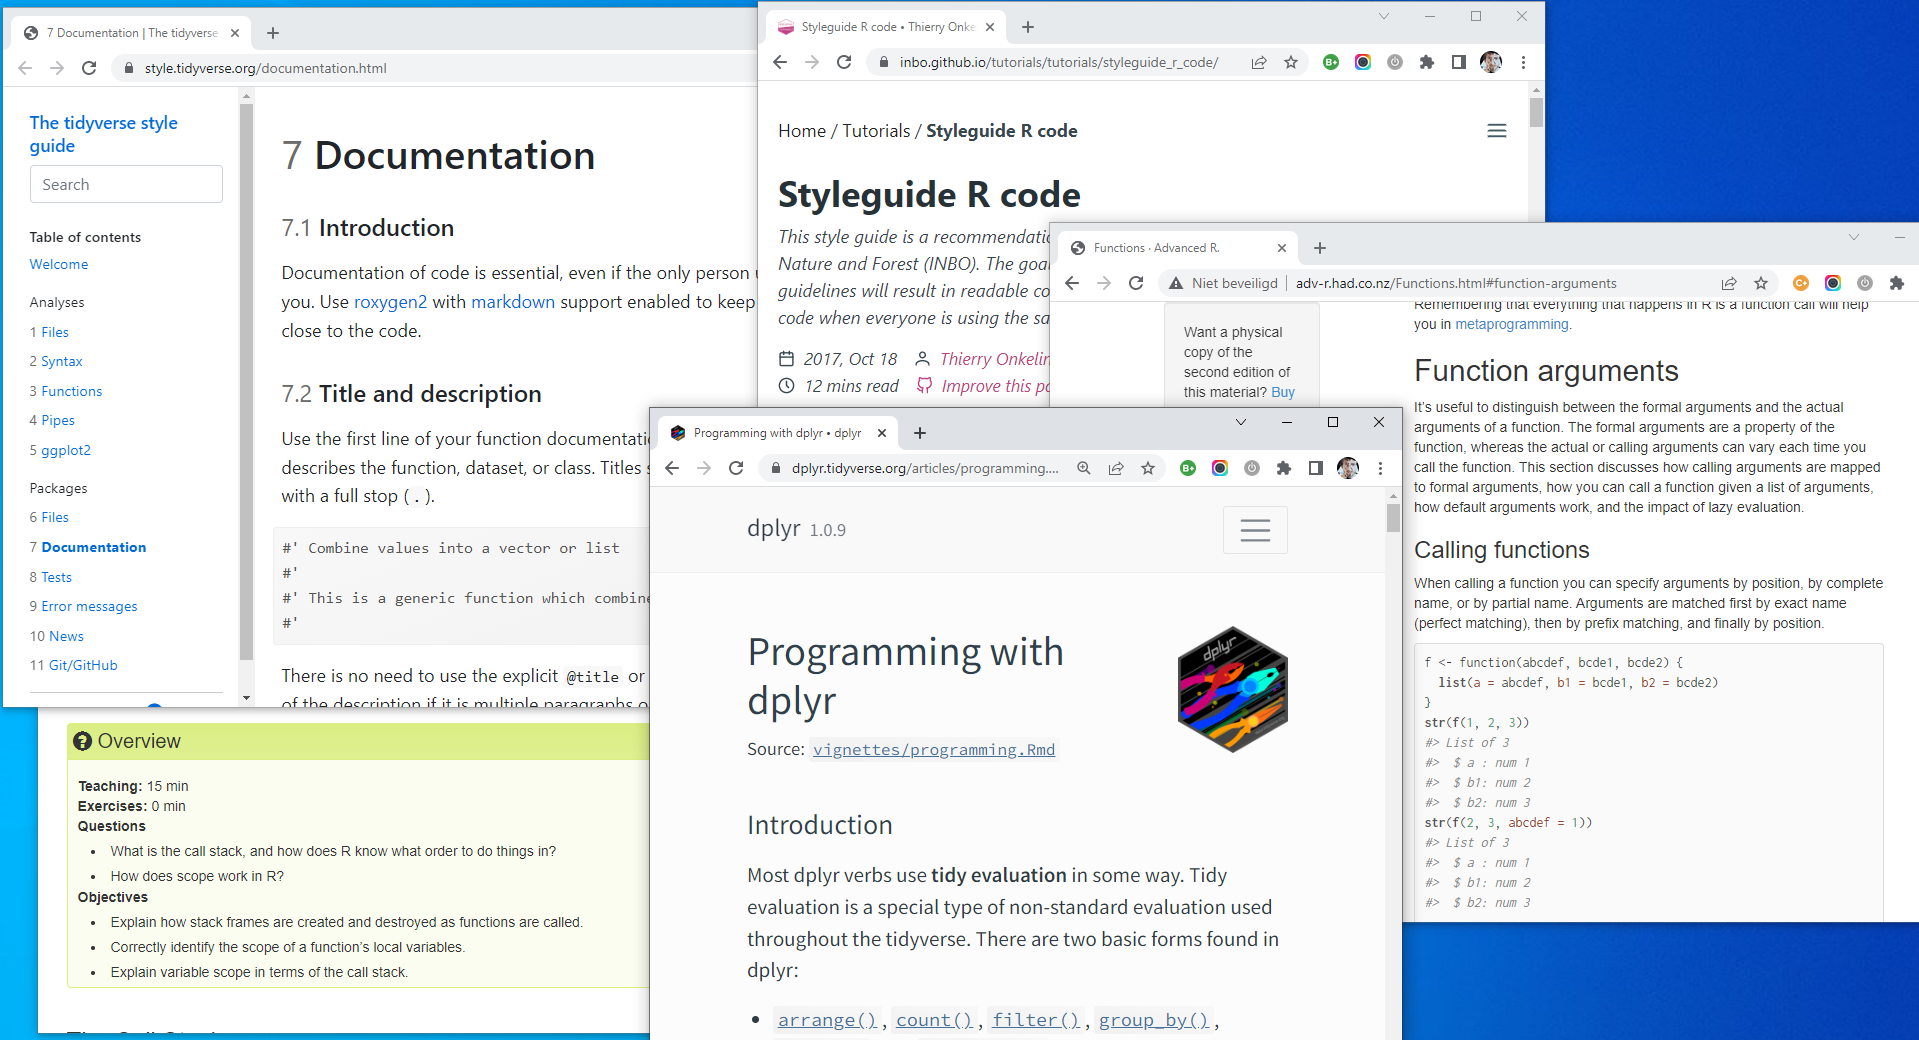 ] --- class: left, top # Summer break July = summer = no INBO coding club ```r library(cowsay) cowsay::say(what = "Enjoy the summeR!", by = "egret", what_color = c("red", "orange", "green", "blue", "purple")) ``` .center[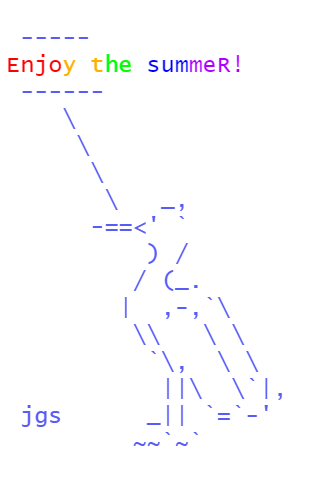] --- class: center, middle  <!-- Adjust the room and date --> Room: 01.05 - Isala Van Diest<br> Date: __30/08/2022__, van 10:00 tot 12:30<br> Subject: **ggplot basics** <br> (registration announced via DG_useR@inbo.be)