class: center, middle  <!-- Do not forget to adapt the presentation title in the header! --> <!-- Adjust the presentation to the session. Focus on the challenges, this is not a coding tutorial. Note, to include figures, store the image in the `/docs/assets/images/yyyymmdd/` folder and use the jekyll base.url reference as done in this template or see https://jekyllrb.com/docs/liquid/tags/#links. using the scale attribute , you can adjust the image size. --> <!-- Adjust the day, month --> # 30 AUGUST 2022 ## INBO coding club <!-- Adjust the room number and name --> Herman Teirlinck Building 01.05 - Isala Van Diest --- class: center, middle <!-- Create a new badge using Inkscape or other programs based on the assets/images/coding_club_badges.svg file -->  --- class: center, top 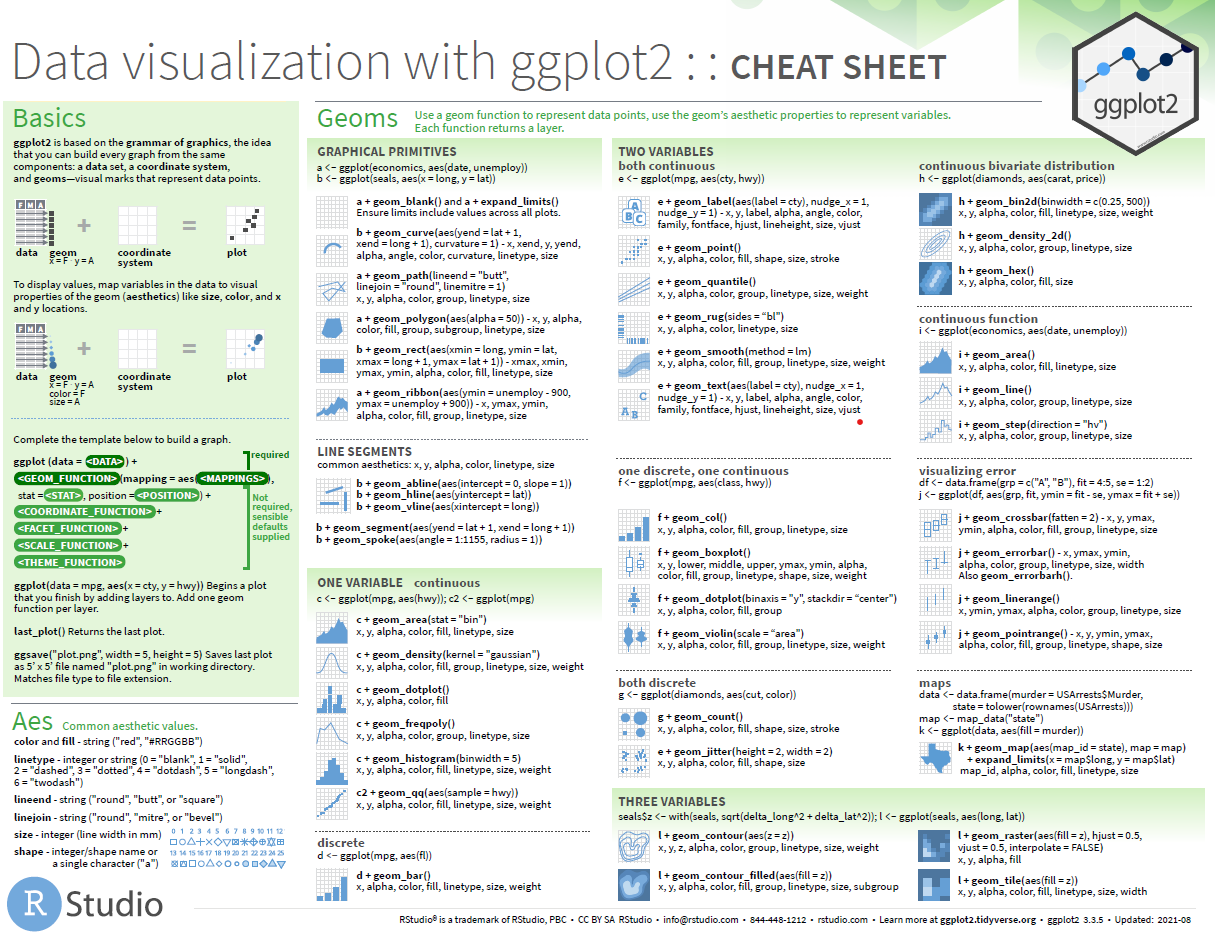 Download [cheatsheet](https://github.com/inbo/coding-club/blob/master/cheat_sheets/20220830_cheat_sheet_ggplot2.pdf) --- class: left, middle ### How to get started? Check the [Each session setup](https://inbo.github.io/coding-club/gettingstarted.html#each-session-setup) to get started. ### First time coding club? Check the [First time setup](https://inbo.github.io/coding-club/gettingstarted.html#first-time-setup) section to setup. --- class: left, top  --- class: center, top # Share your code during the coding session <!-- Create a new hackmd file and replace this link (twice!) --> Go to https://hackmd.io/0LqX6RaATmuklv35n38LeQ?edit and start by adding your name in section "Participants". <iframe src="https://hackmd.io/0LqX6RaATmuklv35n38LeQ?edit" height="400px" width="800px"></iframe> --- class: left, top # Download data and code You can download the material of today: - automatically via `inborutils::setup_codingclub_session()`* - manually** from GitHub folders [coding-club/data/20220830](https://github.com/inbo/coding-club/tree/master/data/20220830) and [coding-club/src/20220830](https://github.com/inbo/coding-club/tree/master/src/20220830) <br> <small> __\* Note__: you can use the date in "YYYYMMDD" format to download the coding club material of a specific day, e.g. run `setup_codingclub_session("20220428")` to download the coding club material of April, 28 2022. If date is omitted, i.e. `setup_codingclub_session()`, the date of today is used. For all options, check the [tutorial online](https://inbo.github.io/tutorials/tutorials/r_setup_codingclub_session/).</small> <br> <small> __\*\* Note__: check the getting started instructions on [how to download a single file](https://inbo.github.io/coding-club/gettingstarted.html#each-session-setup)</small> --- class: left, middle # ggplot recipe: data - mapping - geometry  --- class: left, top # Load libraries ```r library(tidyverse) ``` --- background-image: url(/assets/images/background_challenge_1.png) class: left, top # Challenge 1 After reading the data.frame `survey` (code provided): 1. Plot `hindfoot_length` as function of `weight` using points 2. Plot `weight` as function of `species` using boxplot 3. Replace the previous boxplot with a violin plot 4. How many surveys per gender? Show it as a bar plot 5. How many surveys per year? Show it as bar plot 6. How to get the same plot as in 5 starting from the summarised data, `survey_per_year`? The code to read this data.frame is provided. --- class: left, top ## Intermezzo: aesthetics This works: ``` ggplot(data = survey, mapping = aes(x = species_id, y = weight)) + geom_boxplot() ``` This works too: ``` ggplot(data = survey) + geom_boxplot(mapping = aes(x = species_id, y = weight)) ``` What should I use? Both are good, but... But what if you want to plot two or more geometries with *different* aesthetics? --- background-image: url(/assets/images/background_challenge_2.png) class: left, top # Challenge 2 1. What’s wrong with the code provided? Why are the boxplots not blue and transparency is not correct? How to solve it? 2. Apply the next changes to the first basic plot as provided in the code: - Use `sex` as color - Adjust the transparency (alpha) of the points to 0.5 - Change the y label to "hindfoot length" - Add a title to the graph, e.g. "hindfoot length vs weight" - Use a logarithmic scale for the x-axis - Set points' colors to "red" for females and "yellow" for males 3. Apply the next changes to the second basic plot: - Split bars into `sex` - Arrange bars for `F` and `M` side by side - Adjust the transparency of the bar to 0.5 - Change the y label to "number of surveys" - Add a title to the graph, e.g. "Number of surveys per year" - Flip x and y-axis --- class: left, top ## Intermezzo: facets How to make subplots, one per each `sex` value? One line of code is sufficient! Welcome to the fantastic world of *facets*!  --- background-image: url(/assets/images/background_challenge_3.png) class: left, top # Challenge 3 1. What’s wrong with the code provided? How to correctly plot data with year as x and sex as color? 2. To improve readability of the previous plot we choose to group data at 5 years interval. How to do it? Hint: Check examples at ?geom_boxplot 3. In the intermezzo we saw how to facet based on values of one column, `sex`. How to facet based on two columns? Transform the given plot by using `sex` as facet on the rows and `plot_id` as facet on the columns. Improve labels of facets by showing "var name : var value", e.g. `"plot_id : 1"` for the column or `"sex : F"` for the rows 4. Customize the non-data components of your plots by using `theme()`. E.g. set text size to 8 and text font italic for the facet labels. Use font family Courier New for both legend title and text. Set also legend background color to green. Hint: to know the family fonts installed on your (Windows) laptop, use `windowsFonts()` 5. There are a lot of ggplot themes ready for you to use! Do you know that INBO has its own ggplot theme? Load [INBOtheme](https://inbo.github.io/INBOtheme/) and see how your plots get an INBO charm --- class: left, top ## Resources - [Challenges solutions](https://github.com/inbo/coding-club/blob/master/src/20220830/20220830_challenges_solutions.R) - `ggplot2` website: https://ggplot2.tidyverse.org/ - R for Data Science: [Chapter 3: Data visualization](https://r4ds.had.co.nz/data-visualisation.html) - Article of H. Wickham about the layered [grammar of graphics](http://vita.had.co.nz/papers/layered-grammar.pdf) - [Datacarpentry's data visualiation tutorial](https://datacarpentry.org/R-ecology-lesson/04-visualization-ggplot2.html) - [Stanford University tutorial](https://cengel.github.io/R-data-viz/data-visualization-with-ggplot2.html): chapter 1 - R for Data Science: [Chapter 28: Graphics for communication](https://r4ds.had.co.nz/graphics-for-communication.html) - INBOtheme [homepage](https://inbo.github.io/INBOtheme/) --- class: center, middle  <!-- Adjust the room and date --> Room: 01.71 - Frans Breziers<br> Date: __29/09/2022__, van 10:00 tot 12:30<br> Subject: **boost your graphs** <br> (registration announced via DG_useR@inbo.be)