class: center, middle  <!-- Do not forget to adapt the presentation title in the header! --> <!-- Adjust the presentation to the session. Focus on the challenges, this is not a coding tutorial. Note, to include figures, store the image in the `/docs/assets/images/yyyymmdd/` folder and use the jekyll base.url reference as done in this template or see https://jekyllrb.com/docs/liquid/tags/#links. using the scale attribute , you can adjust the image size. --> <!-- Adjust the day, month --> # 6 OCTOBER 2022 ## INBO coding club <!-- Adjust the room number and name --> Herman Teirlinck Building 01.72 - Kaat Tilley --- class: center, middle <!-- Create a new badge using Inkscape or other programs based on the assets/images/coding_club_badges.svg file -->  --- class: center, top  Download [cheatsheet](https://github.com/inbo/coding-club/blob/master/cheat_sheets/20221006_cheat_sheet_shiny.pdf) --- class: left, top ### How to get started? Check the [Each session setup](https://inbo.github.io/coding-club/gettingstarted.html#each-session-setup) to get started. ### First time coding club? Check the [First time setup](https://inbo.github.io/coding-club/gettingstarted.html#first-time-setup) section to setup. --- class: left, top  --- class: center, top # Share your code during the coding session <!-- Create a new hackmd file and replace this link (twice!) --> Go to https://hackmd.io/wvuvcT1oTRuDby0C__O9AQ?edit and start by adding your name in section "Participants". <iframe src="https://hackmd.io/wvuvcT1oTRuDby0C__O9AQ?edit" height="400px" width="800px"></iframe> --- class: left, top # Download data and code You can download the material of today: - automatically via `inborutils::setup_codingclub_session()`* - manually** from GitHub folders [coding-club/data/20221006](https://github.com/inbo/coding-club/tree/master/data/20221006) and [coding-club/src/20221006](https://github.com/inbo/coding-club/tree/master/src/20221006) <br> <small> __\* Note__: you can use the date in "YYYYMMDD" format to download the coding club material of a specific day, e.g. run `setup_codingclub_session("20220428")` to download the coding club material of April, 28 2022. If date is omitted, i.e. `setup_codingclub_session()`, the date of today is used. For all options, check the [tutorial online](https://inbo.github.io/tutorials/tutorials/r_setup_codingclub_session/).</small> <br> <small> __\*\* Note__: check the getting started instructions on [how to download a single file](https://inbo.github.io/coding-club/gettingstarted.html#each-session-setup)</small> --- class: left, top # Load libraries ```r install.packages("shiny") library(tidyverse) library(shiny) ``` --- background-image: url(/assets/images/background_challenge_1.png) class: left, top # Challenge 1 1. RStudio helps us by providing you a template for our first Shiny web application. Clikc on File -> New File -> Shiny Web App -> Select "Single File" as Application type and create the app within the `src` directory. 2. Which file is created? Run it by clicking the green play button "Run App". How to run the app in viewer pane or externally on a browser? How to run the app as a background job instead of "stealing" your console? Hint: click on the downwards black triangle to explore all options. 3. Every Shiny web application has 3 components (functions). Find them in the web application you are running. What are they responsible for? 4. What does the template show? Where are the data loaded? Where is the histogram generated? 5. What is the `input` and where is generated? What is the `output` and where is generated? 6. Show the eruption time in minutes instead of the waiting time to next eruption. Use "Distribution of eruption times" as histogram title, "minutes" as x label, "number of eruptions" as y label. Hint: check `?hist` 7. Set 20 as default number of bins --- background-image: url(/assets/images/background_challenge_2.png) class: left, top # Challenge 2. Basics We will start to make our own shiny app for visualizing the distribution of two butterflies (_Limenitis camilla_, _Pararge aegeria_) depending on the biotope (Agriculture, Forest, Open, Urban). 1. We first focus on the user interface, the so called UI (`ui <- fluidPage()`). Remove all code within the `server()` function and add in the **sidebarPanel** radio buttons to switch among biotopes and a box with the species to select from. Specify also a general title for your app, a specific title for the biotope radio buttons and a title for the species selection box. Hint: check [lesson 2](https://shiny.rstudio.com/tutorial/written-tutorial/lesson2/) and [lesson 3](https://shiny.rstudio.com/tutorial/written-tutorial/lesson3/) 2. On the **mainPanel**, please, **render** the choices as basic **text**. Hint: check [lesson 4](https://shiny.rstudio.com/tutorial/written-tutorial/lesson4/) At the end you should end up with something like this: 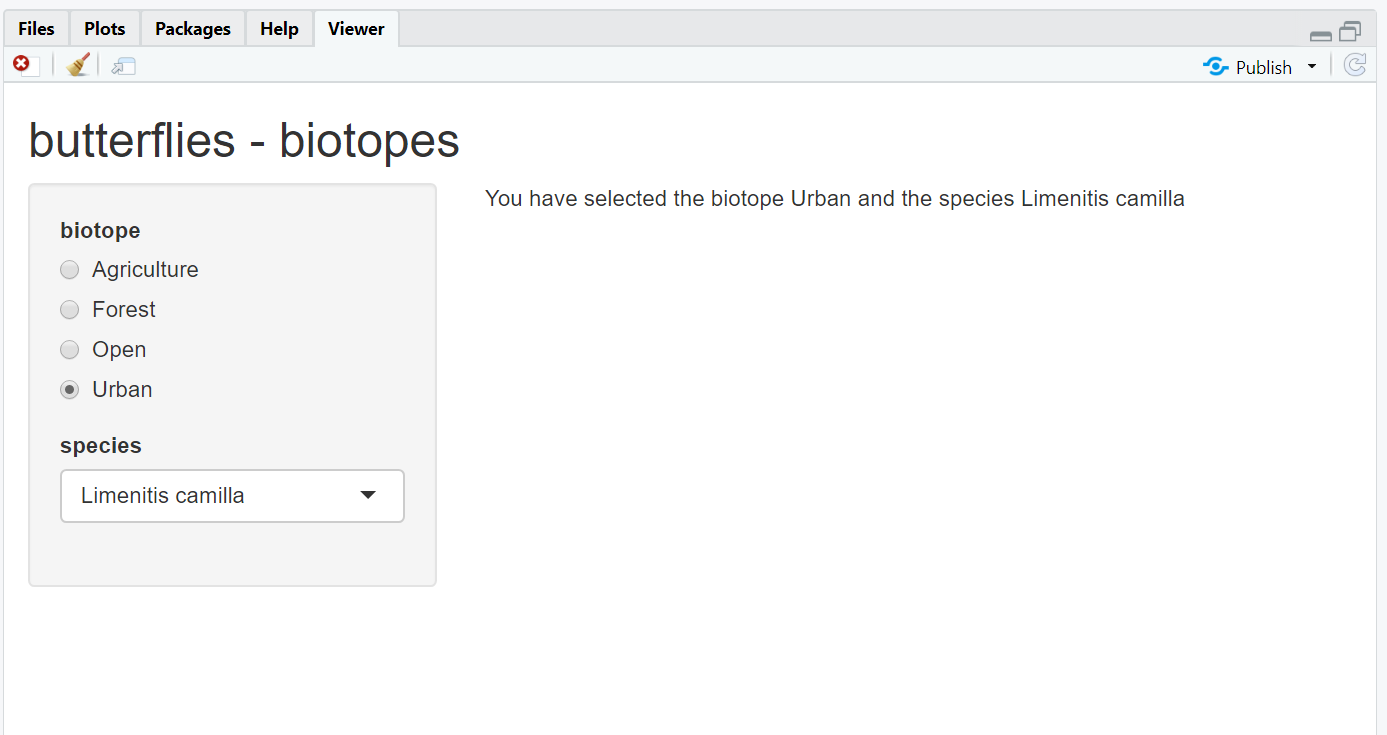 --- background-image: url(/assets/images/background_challenge_2.png) class: left, top # Challenge 3. Plot Are you ready for your fist interactive plot? Based on what you learned up to here and [lesson 5](https://shiny.rstudio.com/tutorial/written-tutorial/lesson5/) we are going to create an interactive ggplot based on the code provided in 20221006_challenges.R. 1. We need to read the `20221006_butterflies_data.txt` file. What is the best folder to store the data our app needs? Hint: see [lesson 5](https://shiny.rstudio.com/tutorial/written-tutorial/lesson5/) 2. Read the data and substitute the hard coded choices in challenge 2 using the provided variables `biotopes` and `sp` in 20221006_challenges.R. 3. **Render** the **plot**. You should get something like this:  --- background-image: url(/assets/images/background_challenge_2.png) class: left, top # Challenge 3. Publish your shiny app A web application should be accessible as a web page, shouldn`t it? Let`s publish our app on [shinyapps.io](https://www.shinyapps.io/)! If you do not have an account, you have to create one, first. Follow the instructions in the pop up window. Some packages will be installed for you.  Once done, you can share it with your colleagues. Mine is deployed on https://damianooldoni.shinyapps.io/challenge3_20221006/ --- class: left, top # Bonus challenge 1. Multiple outputs 1. Add a *data table* with the shown data below the plot. Start simple: filter by species and biotope within each of the two `render*()` functions 2. Now try to avoid filtering twice by making your code *reactive*. Hint: see [lesson 6](https://shiny.rstudio.com/tutorial/written-tutorial/lesson6/) --- class: left, top # Bonus challenge 2. The User Experience You are now a web developer and so you should start to think about the user experience, alias *UX*! One of the main principles to develop a nice web interface is to distinguish filters and selectors: - group *filters* (typically) on the left - *select* output by tabs GBIF website is a very nice example of such principle:  --- class: left, top # Bonus challenge 2. The User Experience Apply this easy principle to your web application. Allow the users to visualize the plot or the data as two different tabs. Hint: have a look at this article about [tabsets](https://shiny.rstudio.com/articles/tabsets.html).  --- class: left, top # Bonus challenge 3. Mastering shiny This final challenge is to show you up how things can get even more complex when you have to take care changes in a reactive way. Up to now, the input butterfly data were immutable. But what if you think such data can change over time and so new species or biotopes could be added/removed? Your app should get noticed about that!* <small> __\* Note__: thanks Thierry for the idea and the provided solution! </small> --- class: left, top # Resources - Solutions are online: [challenge 1](https://github.com/inbo/coding-club/blob/master/src/20221006_solutions_challenge1/app.R), [challenge 2](https://github.com/inbo/coding-club/blob/master/src/20221006_solutions_challenge2/app.R), [challenge 3](https://github.com/inbo/coding-club/blob/master/src/20221006_solutions_challenge3/app.R) and bonus challenges [1-2](https://github.com/inbo/coding-club/blob/master/src/20221006_solutions_challenge_bonus_1-2/app.R) and [3](https://github.com/inbo/coding-club/blob/master/src/20221006_solutions_challenges_bonus_3/app.R) - the edited video recording is available on [vimeo](https://vimeo.com/758703504) - `shiny` [tutorials](https://shiny.rstudio.com/tutorial/) for any level (getting started -> pro users). In particular, this coding club is partly inspired by the shiny [basics tutorial](https://shiny.rstudio.com/tutorial/written-tutorial/lesson1/) - Dive in shiny [reactivity](https://shiny.rstudio.com/articles/reactivity-overview.html) - so many well written [articles](https://shiny.rstudio.com/articles/) on shiny website! - a 16 min read about the [User Experience design principles](https://www.ramotion.com/blog/ux-design-principles/#section-2-visual-aspects) --- class: center, middle  <!-- Adjust the room and date --> Room: 01.05 - Isala Van Diest<br> Date: __25/10/2022__, van 10:00 tot 12:30<br> Subject: **geospatial data in R with sf** <br> (registration announced via DG_useR@inbo.be)