class: center, top  <!-- Do not forget to adapt the presentation title in the header! --> <!-- Adjust the presentation to the session. Focus on the challenges, this is not a coding tutorial. Note, to include figures, store the image in the `/docs/assets/images` folder and use the jekyll base.url reference as done in this template or see https://jekyllrb.com/docs/liquid/tags/#links. using the scale attribute , you can adjust the image size. --> <!-- Adjust the day, month --> # 28 FEBRUARY 2023 ## INBO coding club <!-- Adjust the room number and name --> Herman Teirlinck<br> 01.04 Transitielab<br> --- class: left, top ## ROOMIE: room reservation ``` > if (isFALSE(roomie)) { + warning("Please confirm asap the room reservation on the roomie") + } Warning message: Please confirm asap the room reservation on the roomie ``` --- class: left, top ## Record the session  Kind reminder to... myself. --- class: center, middle Well done, Dirk! Oops, prof. Maes, I mean! 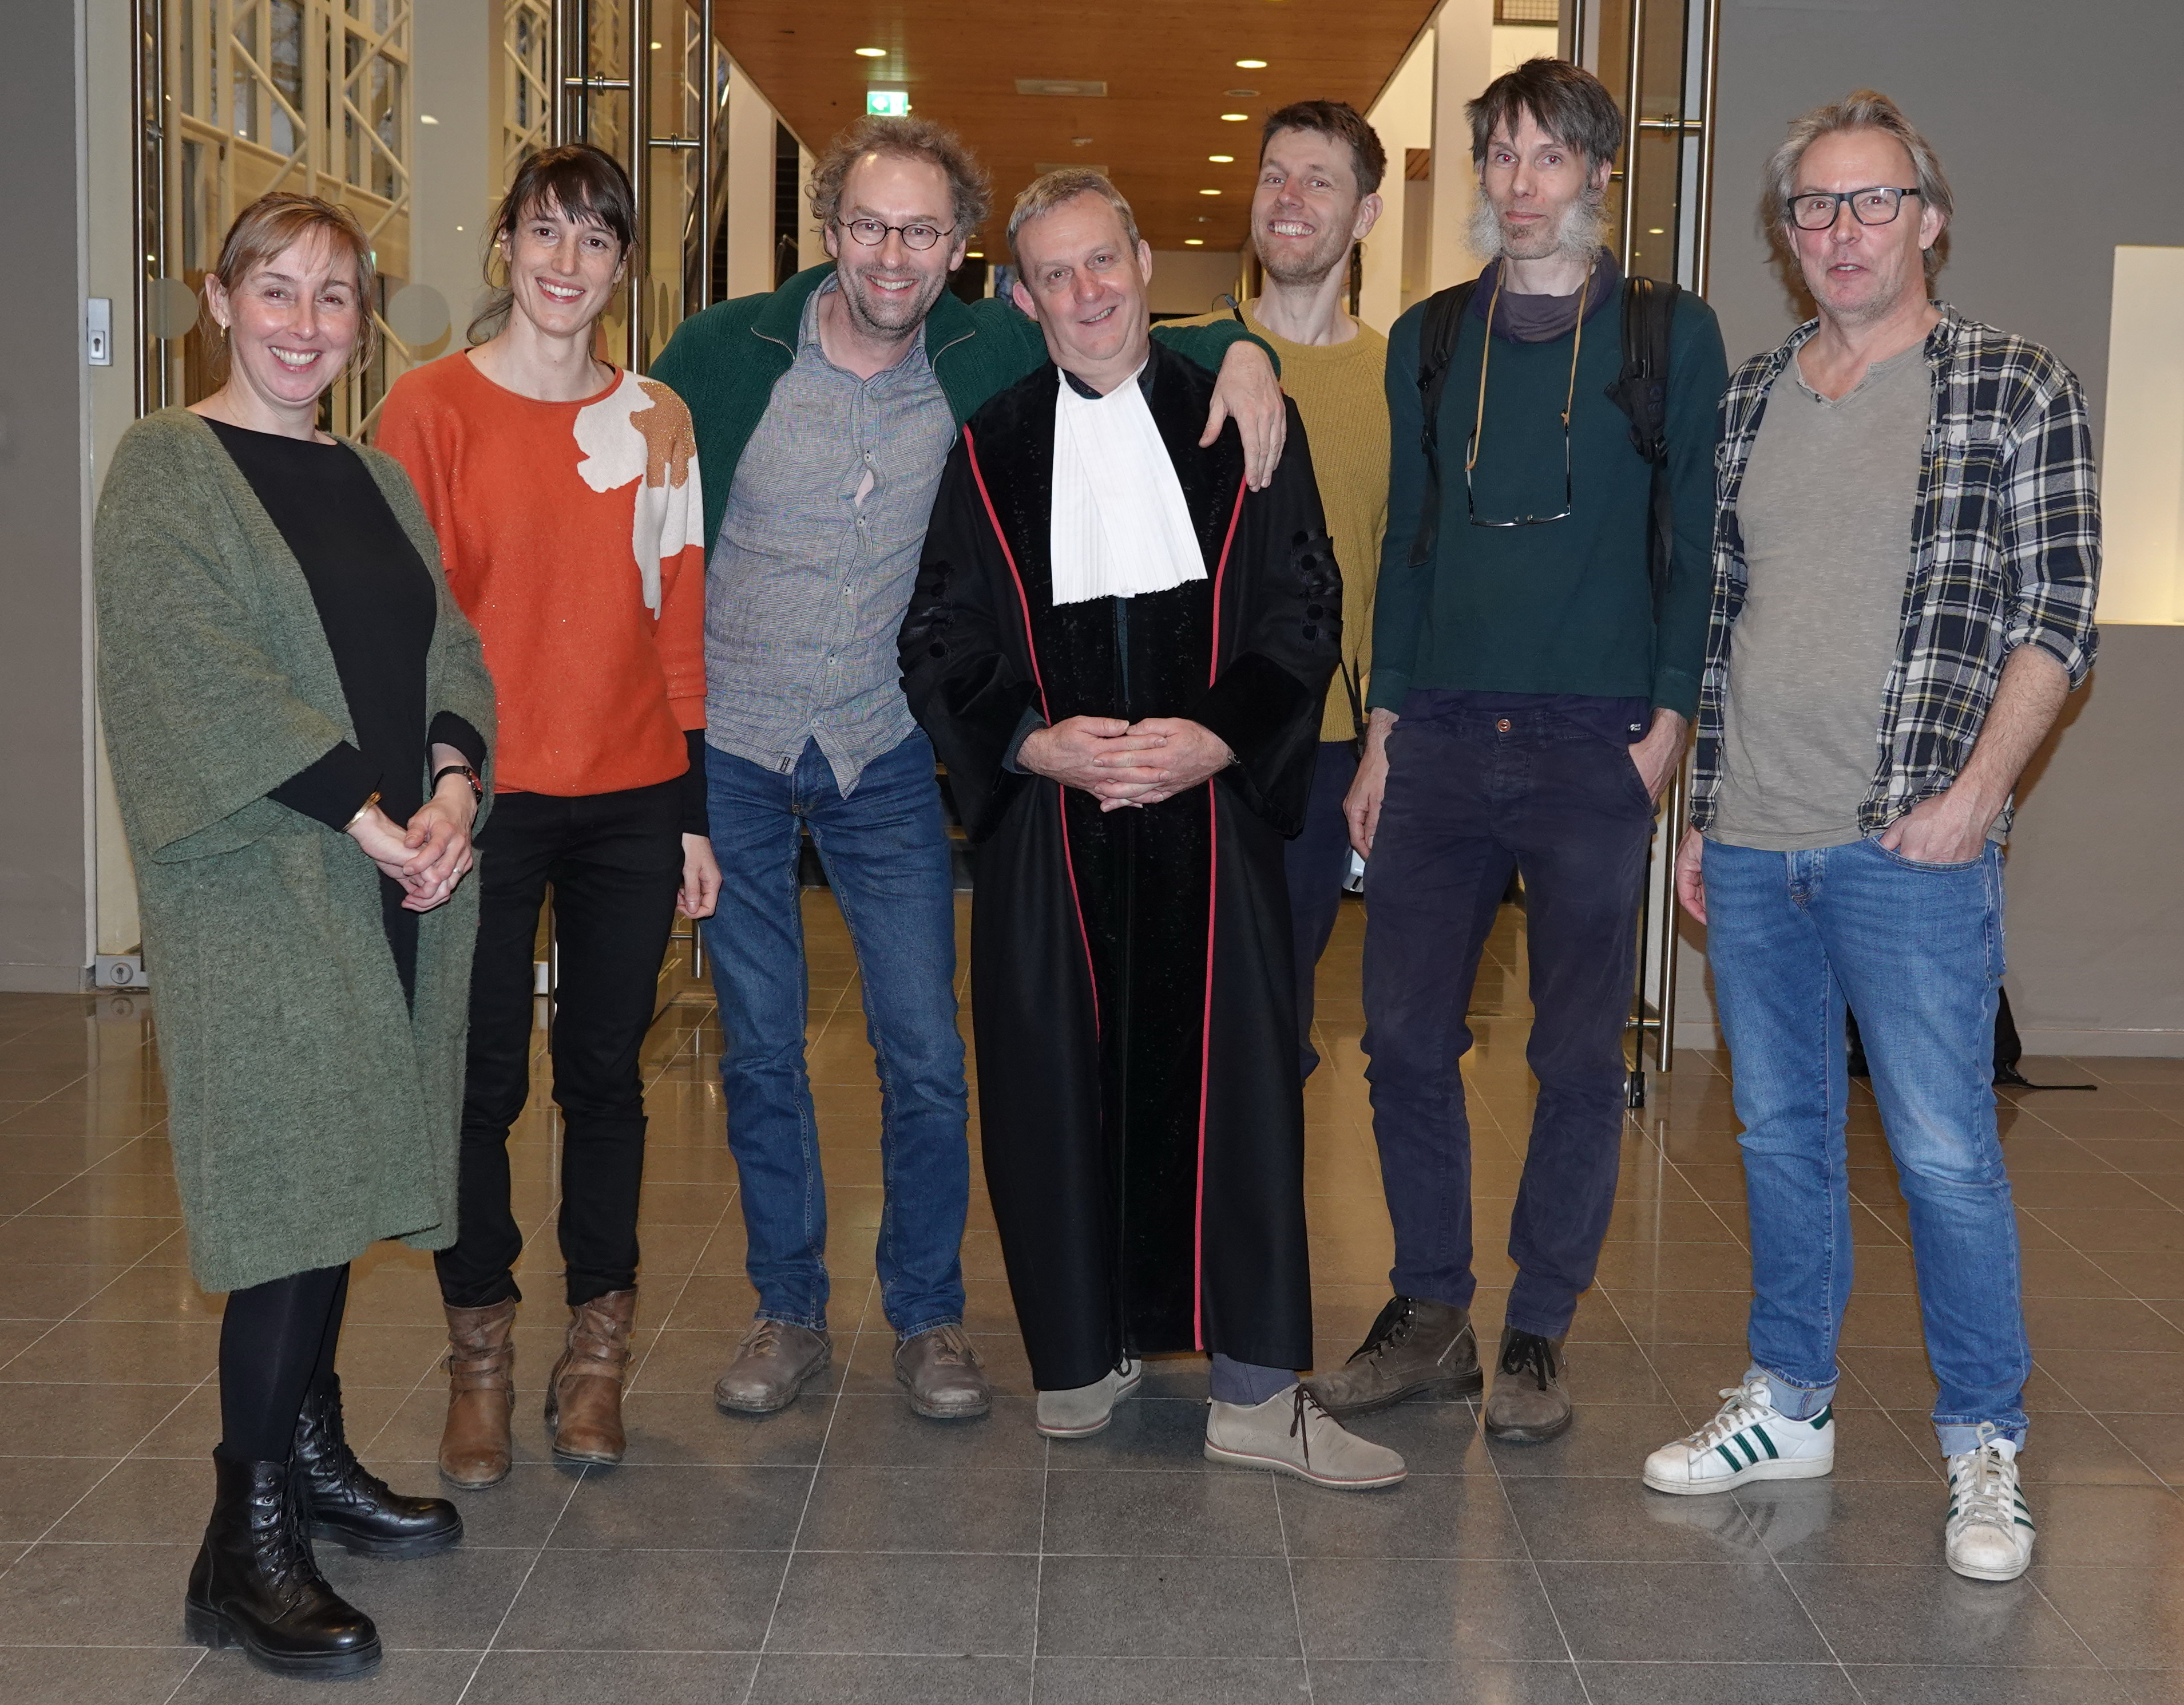 --- class: center, middle <!-- Create a new badge using Inkscape based on the assets/images/coding_club_badges.svg file -->  --- class: left, top ## The open source community: stackoverflow A couple of days after the last coding club about dates and strings, I got this mail referring to a string related [question](https://stackoverflow.com/questions/63631764/how-to-sort-data-frame-by-columns-with-strings-containing-different-number-of-di/75282551#75282551) of mine of two years ago. 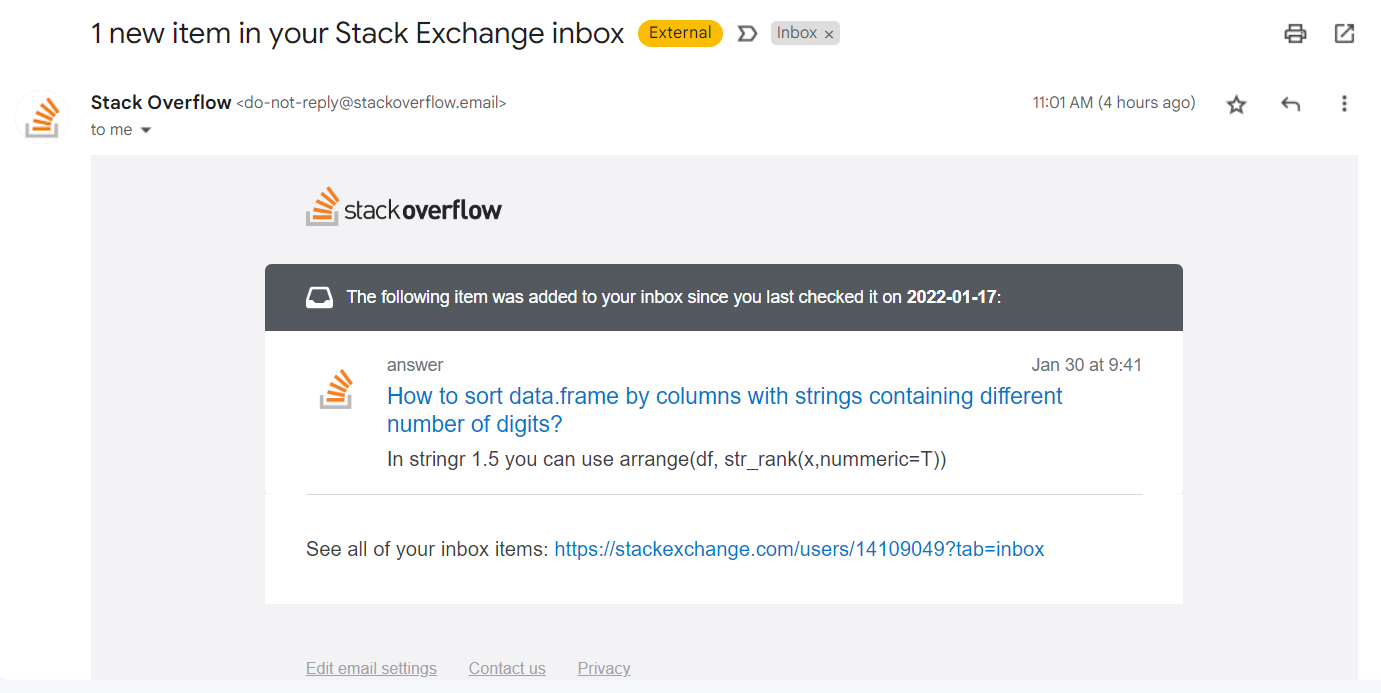 --- class: left, top The [dplyr cheat sheet](https://github.com/inbo/coding-club/blob/master/cheat_sheets/20230228_cheat_sheet_data_transformation.pdf) 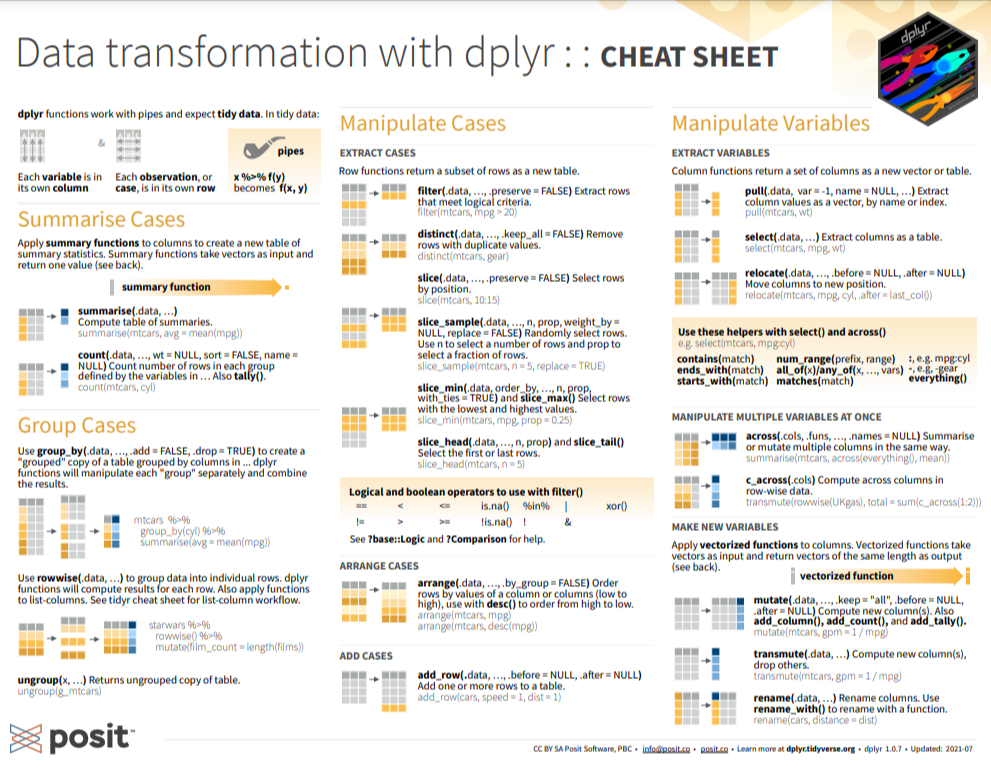 New to dplyr? The best resource for self study is the [data transformation chapter](https://r4ds.had.co.nz/transform.html) in R for data science. --- class: left, top # R packages Loading tidyverse is enough: ```r library(tidyverse) # it imports dplyr as well ``` --- class: center, top ### How to get started? Check the [Each session setup](https://inbo.github.io/coding-club/gettingstarted.html#each-session-setup) to get started. ### First time coding club? Check the [First time setup](https://inbo.github.io/coding-club/gettingstarted.html#first-time-setup) section to setup. --- class: left, top  --- class: center, top ### Share your code during the coding session! <!-- Create a new hackmd file and replace this link (twice!) --> Go to https://hackmd.io/B8aoQT_YRUOVks-j916YPA?both <iframe src="https://hackmd.io/B8aoQT_YRUOVks-j916YPA?edit" height="450px" width="800px"></iframe> --- class: left, top # Download data and code - Download everything automatically via `inborutils::setup_codingclub_session()` - manually*, from [data/20230228](https://github.com/inbo/coding-club/blob/master/data/20230228/) and [src/20230228](https://github.com/inbo/coding-club/blob/master/src/20230228). Place the R script in `/src/20230228/` and data in `/data/20230228/`. <small>* __Note__: check the getting started instructions on [how to download a single file](https://inbo.github.io/coding-club/gettingstarted.html#each-session-setup)</small> --- class: left, top # Data and scripts description - Partridge data is inspired by the [yearly partridge counting](https://www.natuurenbos.be/patrijs) that is done from January 15th untill March 31st. Each game management unit (wildbeheerseenheid, **WBE**) is required to count partridges in their territory if they want to hunt them. There are two dataframes: 1. [20230228_partridge.txt](https://github.com/inbo/coding-club/blob/main/data/20230228/20230228_partridge.txt): a dataset with observations of partridges. This includes the date of the observation, the fieldworker who submitted the observation, the type of observation (`couple`, `single`, `group`, or only `sound`), and location (WBE number and coordinates `x`, `y`). 2. [20230228_wbe_info.txt](https://github.com/inbo/coding-club/blob/main/data/20230228/20230228_wbe_info.txt): for each WBE, this dataframe contains the unique identification number (`wbe`), name, province, and surface area. - [20230228_ias_plants.txt](https://github.com/inbo/coding-club/blob/main/data/20230228/20230228_ias_plants.txt): a list of invasive alien plants. One column contain the scientific names, while the others contain vernacular names in English, Dutch and French. - [20230228_challenges.R](https://github.com/inbo/coding-club/blob/master/src/20230228/20230228_challenges.R): R script to start from (some code is already provided) --- class: left, top # Why dplyr? A lot of reasons. But the main one is that it makes data manipulation code easy to read (in comparison with basic R). Other important reasons? - very actively maintained (people from posit, the company behind RStudio) and works nicely with all other tidyverse packages. - open development on [GitHub](https://github.com/tidyverse/dplyr/): issues, questions, dev ideas etc. are welcome. - functions have very good names. Some of them are exactly the same as in SQL, e.g. `filter()`, `select()`. --- background-image: url(/assets/images/background_challenge_1.png) class: left, top # Challenge 1 - Single table verbs [Single table verbs](https://dplyr.tidyverse.org/articles/dplyr.html#single-table-verbs) = functions working on one data.frame. After reading `partridge` dataset (code provided): 1. Display first 8 rows; display the last 8 rows. 2. Select columns `wbe` and `date`. 3. Display the values of `type`. How many different values of `type` are? 4. How to remove observations with type `Sound`? How to remove observations with type `Sound` and `wbe` NA? 5. Add a new column called `seen` which is TRUE if `type` is not `"Sound"`. Add a column `month` with the month of the observation. Tip: use `lubridate::month()` function. Install lubridate package if not yet done. 6. Place the column `seen` after `type` and `month` after `date` --- class: left, top ## Intermezzo - The pipe %>% From [dplyr](https://dplyr.tidyverse.org/articles/dplyr.html#the-pipe) documentation:  Example inspired by challenge 1: ``` partridge %>% mutate(seen = if_else(type != "Sound", TRUE, FALSE), month = (lubridate::month(date))) %>% distinct(wbe, type, seen, date, month) %>% filter(wbe > 530) %>% relocate(seen, .after = type) %>% relocate(month, .after = date) ``` --- background-image: url(/assets/images/background_challenge_2.png) class: left, top # Challenge 2 - Summaries 1. How many observations per WBE? Save it as `overview_partridge` as we will use it in challenge 3. 2. How many observations per WBE and type? 3. Order the previous output per n_obs (descending order), wbe (ascending order) and type (alphabetically). 4. For each month, return the wbe with the highest number of observations and report the number of observations for those wbe that month. --- class: left, top ## Intermezzo - Two-table verbs Two-table verbs = functions which take two data.frames as input to typically return one data.frame as output. A nice [article](https://dplyr.tidyverse.org/articles/two-table.html) on dplyr website.  --- background-image: url(/assets/images/background_challenge_3.png) class: left, top # Challenge 3 - Two-table verbs After reading the game management units details as `WBE` (code provided): 1. Add WBE details in `WBE` to `overview_partridge` (where available) 2. How are the columns ordered? Are the columns of `overview_partridge` on the left? Try to put them on the right. 3. Which WBEs are not in `partridge`, i.e. are not linked to any observation? 4. Some observations have a missing value for column `wbe` and some WBEs have no observations at all. Get rid of them while joining. 5. Now, join both again but retain ALL EXISTING WBEs. Set the number of observations equal to 0 for all WBEs where no partridges were observed. --- class: left, top # dplyr is a living thing We said at the beginning that dplyr is actively maintained. There is more! dplyr is actually moving forward to get better and better. dplyr released recently an important new version, dplyr 1.1.0. It means new very nice functions have been added, other older functions got superseded or some arguments are deprecated etc. Read more in this 4 blogposts: - [dplyr 1.1.0: joins](https://www.tidyverse.org/blog/2023/01/dplyr-1-1-0-joins/) - [dplyr 1.1.0: Per-operation grouping](https://www.tidyverse.org/blog/2023/02/dplyr-1-1-0-per-operation-grouping/) - [dplyr 1.1.0: The power of vctrs](https://www.tidyverse.org/blog/2023/02/dplyr-1-1-0-vctrs/) - [dplyr 1.1.0: pick(), reframe(), and arrange()](https://www.tidyverse.org/blog/2023/02/dplyr-1-1-0-pick-reframe-arrange/) --- class: left, top # dplyr is a living thing An example: ``` people <- tibble( first_name = c("Amber", "Damiano", "Dirk", "Emma", "Raïsa", "Hans"), second_name = c("Mertens", "Oldoni", "Maes", "Cartuyvels", "Carmen", "Vancalster") ) hobbys <- tibble( # purely invented! people = c("Hans", "Damiano", "Dirk", "Amber", "Emma", "Raïsa"), sport = c("rugby", "football", "hockey", "ski", "tennis", "bowling") ) # old dplyr, still works! You need "" = "". people %>% left_join(hobbys, by = c("first_name" = "people") ) # now you can use join_by() and colnames without " " people %>% left_join(hobbys, join_by(first_name == people)) ``` --- class: left, top # Bonus challenge - Create tidy data with tidyr Sometimes, the first data manipulation you have to perform is to create tidy data. dplyr might not suffice: you will need another important tidyverse package: [tidyr](https://tidyr.tidyverse.org/). Tidy data is data where: - Every column is variable. - Every row is an observation. - Every cell is a single value. --- class: left, top # Bonus challenge - Create tidy data with tidyr After reading `20230228_ias_plants.txt` dataset, make it tidy. Please notice that, for some species, two vernacular names are given. See figure below.  --- class: left, top # Bonus challenge - Sharing is caring This is not really a challenge. As we are learning from each other, why not share your experience with dplyr in the hackmd? Have you ever written a tough data manipulation piece of code using dplyr functions? Share it! If you can, provide a minimal input example tomake it reproducible. Thanks! --- class: left, top # The package of the month. Damiano's choice [tidylog](https://github.com/elbersb/tidylog): provides feedback about dplyr and tidyr operations. I like it a lot, especially while joining dataframes and using long pipes: ``` joined <- left_join(nycflights13::flights, nycflights13::weather, by = c("year", "month", "day", "origin", "hour", "time_hour")) #> left_join: added 9 columns (temp, dewp, humid, wind_dir, wind_speed, …) #> > rows only in nycflights13::flights 1,556 #> > rows only in nycflights13::weather ( 6,737) #> > matched rows 335,220 #> > ========= #> > rows total 336,776 ``` ``` summary <- mtcars %>% select(mpg, cyl, hp, am) %>% filter(mpg > 15) %>% mutate(mpg_round = round(mpg)) %>% group_by(cyl, mpg_round, am) %>% tally() %>% filter(n >= 1) #> select: dropped 7 variables (disp, drat, wt, qsec, vs, …) #> filter: removed 6 rows (19%), 26 rows remaining #> mutate: new variable 'mpg_round' (double) with 15 unique values and 0% NA #> group_by: 3 grouping variables (cyl, mpg_round, am) #> tally: now 20 rows and 4 columns, 2 group variables remaining (cyl, mpg_round) #> filter (grouped): no rows removed ``` --- class: left, top # Closing the circle Back to my stackoverflow question mentioned at the beginning. dplyr is a powerful tool, but it becomes even more powerful if coupled with other tidyverse packages, stringr in this case: ``` a <- tibble( name = c("Damiano", "Amber", "Hans", "Dirk", "Emma", "Raïsa"), my_favorite_number_string = c("104", "023", "07", "666", "3", "9") ) > a %>% arrange( str_rank(my_favorite_number_string, numeric = TRUE) # from stringr package ) # A tibble: 6 × 2 name my_favorite_number_string <chr> <chr> 1 Emma 3 2 Hans 07 3 Raïsa 9 4 Amber 023 5 Damiano 104 6 Dirk 666 ``` --- class: left, top # Resources - The commented [solutions](https://github.com/inbo/coding-club/blob/main/src/20230228/20230228_challenges_solutions.R) are available. You can download them automatically via `inborutils::setup_codingclub_session("20230228")` - Edited [video recording](https://vimeo.com/805138374) is available on the INBO coding club channel (vimeo) - [dplyr cheat sheet](https://github.com/inbo/coding-club/blob/master/cheat_sheets/20230228_cheat_sheet_data_transformation.pdf). - [tidyr cheat sheet](https://github.com/inbo/coding-club/blob/master/cheat_sheets/20230228_cheat_sheet_tidyr.pdf). - [dplyr](https://dplyr.tidyverse.org/) package documentation. - [tidyr](https://tidyr.tidyverse.org/) package documentation. - [data transformation chapter](https://r4ds.had.co.nz/transform.html) in the [R for data science](https://r4ds.had.co.nz/index.html) book. - [tidylog](https://github.com/elbersb/tidylog) package. --- class: left, top # Coding club topics 2023: you vote! Every month you can vote among **two topics**! Poll for March's coding club is still open! Let us know your favorite before tomorrow! https://forms.gle/pEQi153z8q9juDEy7 You can choose between: - Make great plots with ggplot (level: beginner/intermediate). - Read data from INBO databases in R (credentials needed). --- class: center, middle  <!-- Adjust the room number and name --> Topic: making outstanding plots with ggplot OR read data from INBO databases in R <br> Room: HT - 01.05 - Isala Van Diest <br> Date: **30/03/2023**, from **10:00** to **12:30** <br> Help needed with technical setup? You are welcom from **9:45am**