class: center, middle  <!-- Do not forget to adapt the presentation title in the header! --> <!-- Adjust the presentation to the session. Focus on the challenges, this is not a coding tutorial. Note, to include figures, store the image in the `/docs/assets/images/yyyymmdd/` folder and use the jekyll base.url reference as done in this template or see https://jekyllrb.com/docs/liquid/tags/#links. using the scale attribute , you can adjust the image size. --> <!-- Adjust the day, month --> # 26 JUNE 2025 ## INBO coding club <!-- Adjust the room number and name --> Herman Teirlinck Building 01.71 - Frans Breziers --- class: left, top # Reminders 1. Did we confirm the room reservation on the _roomie_? 2. Did we start the recording? --- class: center, middle <!-- Create a new badge using Inkscape or other programs based on the assets/images/coding_club_badges.svg file -->  --- class: left, top # Introduction: coding is cooking Coding is cooking! 🍲 🥘 Working with functions is like using a food processor (NL: keukenrobot). A **function** is like a **recipe**. - With a food processor, you can use preset recipes, but you can also create your own recipes. - Working with functions, you can use preset functions (`names()`, `length()`, `median()`, ...), but you can also create your own functions. .center[] <small> Photo taken from https://www.livingalifeincolour.com/kitchen/equipment/appliances/ under a Creative Common licence. </small> --- class: left, top # Introduction: coding is cooking Imagine you have a food processor here in front of you: - You can define your own **recipe** by defining the needed **ingredients**, the **actions** to perform and then save it for later use by giving it a **name**. - You can define your own **function** by defining the needed **input arguments**, the **code** to execute and then save it for later use by giving it a **name**. .center[] --- class: left, top # Introduction: coding is cooking My recipe, ehum, function: ``` make_bread <- function(grains, yeast, water, salt) { # Code to generate `bread`. # The code here can be easy (easy bread recipes do exist) # or quite complex (complex bread recipes exist as well) bread <- grains + yeast + water + salt return(bread) } ``` --- class: left, top # Introduction: coding is cooking - When ready, you can add ingredients to the food processor, select your own recipe, press `Play` and you will get the **food**. - When ready, you can pass inputs to the function, call your own function, press `Enter` and you will get the **output**. ``` # Prepare ingredients on the table = Define input values my_grains <- 20 my_yeast <- 1 my_water <- 2 my_salt <- 3 # Add ingredients in the food processor = Pass input values to arguments of the function my_bread <- make_bread( grains = my_grains, yeast = my_yeast, water = my_yeast, salt = my_yeast ) # Press `Enter` my_bread ``` --- class: left, top # Introduction: coding is cooking You can use: - the same recipe with different ingredients - the same function with different input arguments ``` # Use the recipe with different (amount of) ingredients bread1 <- make_bread( grains = grains1, yeast = yeast1, water = water1, salt = salt1 ) bread2 <- make_bread( grains = grains2, yeast = yeast2, water = water2, salt = salt2 ) ``` --- class: left, top # Introduction: coding is cooking Or, you can have: - different recipes using the same ingredients - different functions using the same input arguments ``` # Make savory pie dough with the same ingredients savory_pie_dough1 <- make_savory_pie_dough( grains = grains1, yeast = yeast1, water = water1, salt = salt1 ) # Make focaccia with the same ingredients focaccia1 <- make_focaccia( grains = grains1, yeast = yeast1, water = water1, salt = salt1 ) ``` --- class: left, top # Introduction: When do we need functions? If both these conditions are true: - you have to `"do something"` longer than one line of code - you need to `"do something"` at least for two different inputs --- class: left, top # Introduction: When should we use functions? - the `"do something"` is actually a workflow: split it in (small) functions - the `"do something"` is very short (e.g. a one-line formula) but often used: putting it in a function will give it an understandable name and will avoid typos .center[ ] --- class: left, top # Introduction: good names Functions are the building blocks of your data analysis: give your functions understandable and short enough names. It's better for future-you, it's better for everybody. Naming things is an art, a special skill: for some people, it is a job! From the B-Cubed software development guide (section [Naming functions](https://docs.b-cubed.eu/dev-guide/#r-function-naming)): _Use **verbs** to name functions whenever possible, this is a clear indication that a function does something, in contrast to other objects. For more guidance please refer to the tidyverse style guide [section on functions](https://style.tidyverse.org/functions.html#naming). Keep in mind that the name of the function should describe what it does as closely as possible._ _If you find this difficult, consider if your function isn’t doing too much. Ideally a function should only do one thing, and only return one thing._ --- class: left, top # Introduction: multiple outputs? - Can your recipe prepare different meals at the same time? No. - Can a R function return multiple outputs? No. R functions return only **one output**: `return(my_meal)` But you can put your outputs (e.g. a data.frame and a plot) in a list. A named list will make everybody and the future-you very happy: documentation begins by naming things :-) ```r make_doughs <- function(grains, yeast, water, salt) { # Code to generate `bread` and `focaccia` bread <- grains + yeast + water + salt focaccia <- grains + 1.5 * yeast + 0.7 * water + 2 * salt # Combine bread and focaccia as a list of doughs doughs <- list(bread = bread, focaccia = focaccia) return(doughs) } doughs <- make_doughs(grains = 20, yeast = 1, water = 2, salt = 3) doughs$bread > 26 doughs$focaccia > 28.9 ``` --- class: center, top ### How to get started? Check the [Each session setup](https://inbo.github.io/coding-club/gettingstarted.html#each-session-setup) to get started. ### First time coding club? Check the [First time setup](https://inbo.github.io/coding-club/gettingstarted.html#first-time-setup) section to setup. --- class: left, top  --- class: center, middle # Share your code during the coding session <!-- Create a new hackmd file and replace this link (twice!) --> Go to https://hackmd.io/4OyTIXFVSTiauDyZg8AsSA?edit and start by adding your name in section "Participants". <iframe src="https://hackmd.io/4OyTIXFVSTiauDyZg8AsSA?edit" height="400px" width="800px"></iframe> --- class: left, top # Download data and code You can download the material of today: - automatically via `inborutils::setup_codingclub_session()`* - manually** from GitHub folders [coding-club/data/20250626](https://github.com/inbo/coding-club/tree/master/data/20250626) and [coding-club/src/20250626](https://github.com/inbo/coding-club/tree/master/src/20250626) <br> <small> __\* Note__: you can use the date in "YYYYMMDD" format to download the coding club material of a specific day, e.g. run `setup_codingclub_session("20201027")` to download the coding club material of October, 27 2020. If date is omitted, the date of today is used. For all options, check the [tutorial online](https://inbo.github.io/tutorials/tutorials/r_setup_codingclub_session/).</small> <br> <small> __\*\* Note__: check the getting started instructions on [how to download a single file](https://inbo.github.io/coding-club/gettingstarted.html#each-session-setup)</small> --- class: left, top # Challenge 0 Let's warm up. In the intro we wrote the function `make_doughs()`: ``` make_doughs <- function(grains, yeast, water, salt) { # Code to generate `bread` and `focaccia` bread <- grains + yeast + water + salt focaccia <- grains + 1.5 * yeast + 0.7 * water + 2 * salt # Combine bread and focaccia as a list of doughs doughs <- list(bread = bread, focaccia = focaccia) return(doughs) } ``` If you only have this function, you are not allowed to prepare only bread, or only focaccia. That's a pity, no? Programmers say that this function needs _refactoring_, an improvement as the function is not _atomic_*, it does too much. We can rewrite it as the composition of two _atomic_ functions: `make_bread()` and `make_focaccia()`. 1. Write `make_bread()` and `make_focaccia()`. They return bread and focaccia respectively. 2. Use them to rewrite `make_doughs()`. <br> <small> \* Atomic = not divisible in smaller parts. Ok, atoms are divisible in smaller parts, but we are not in the atomic world :-) </small> --- class: left, top # Edna and the moths Edna\* is not only a lepidopterist: she likes data science and she uses R to do that. She collected data about moths yearly in some locations in Belgium. She has also written some code to analyse the data. But she is not happy with her code: it is not modular, it is not reusable, it is not easy to read and understand. She has asked you to help her to improve her code by (re)writing it using functions. You are happy to help her. <br> <small> \* The fictive Edna character is a tribute to [Edna Mosher](https://en.wikipedia.org/wiki/Edna_Mosher), Canadian entomologist and lepidopterist known for her pioneering work on Lepidoptera pupae morphology (source: [Wikipedia](https://en.wikipedia.org/wiki/Edna_Mosher)). </small> .center[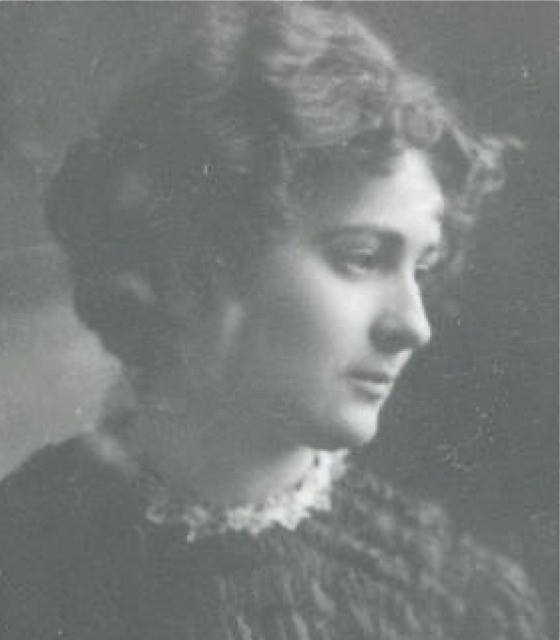] <br> <small> By Cgrinter - Own work, CC BY-SA 4.0, https://commons.wikimedia.org/w/index.php?curid=159211100 </small> --- class: left, top # Best practices and suggestions - Leave the given script (`20250626_challenges.R`) as it is, so that you can always refer to it, while writing the functions. - Create a new file, e.g. `20250626_functions.R`: it must contains only the functions. It's like a cookbook with the recipes. - Create a new file, e.g. `20250626_workflow.R`: it contains only your code where you will use the functions. - **Source** `20250626_functions.R`, e.g. run `source("./src/20250626/20250626_functions.R")` or just click the "Source" button in RStudio, everytime you change the functions. This way, you can test your functions while writing them. --- background-image: url(/assets/images/background_challenge_1.png) class: left, top # Challenge 1 For this challenge, you will use Edna's code in section `# CHALLENGE 1 ####` of file `20250626_challenges.R`. 1. Write a function called `read_moth()` that reads the moth data from a file and returns a data frame. The function should have an argument: `year` (number), which is the year of the data to read. Tip: `sprintf()` can be useful, e.g. `sprintf("Damiano is born in %d.", 1982)`. 2. Edna adds a `year` column immediately in her workflow. So, please add this small step in `read_moth`. 3. Write three functions: `get_effort()`, `get_abundance()` and `get_richness()` to calculate respectively the yearly effort, abundance and richness. The function must have an argument: `df` (data frame), which is the data to use. The function should return a data frame with the effort, abundance, or richness. --- class: left, top # Intermezzo 1: what happens in the function, stays in the function! Unfortunately not in R :-/ ```r grains <- 30 make_tricky_bread <- function(yeast, water, salt) { # `grains` is not defined as argument! Sitll, the function works... bread <- grains + yeast + water + salt return(bread) } make_tricky_bread(1, 10, 2) #> [1] 43 make_tricky_bread(2, 15, 5) #> [1] 52 make_tricky_bread(0.5, 20, 3.5) #> [1] 54 ``` Even if it works, it is **bad** practice as you may end up with wrong results.* Better an error than a wrong result, right? So, please, be careful! <br> <small> __\* Note__: This aspect was mentioned already during a session about debugging, see [slide 38](https://inbo.github.io/coding-club/sessions/20240827_the_art_of_debugging.html#38). </small> --- background-image: url(/assets/images/background_challenge_2.png) class: left, top # Challenge 2: defaults and arguments In this challenge you will use Edna's code in section `# CHALLENGE 2 ####` of file `20250626_challenges.R`. 1. Improve the functions `get_effort()`, `get_abundance()` and `get_richness()` by adding two arguments, `breaks` (numeric vector) and `labels` (character vector). Use the values provided by Edna as default values. The improved functions will return a data frame with a column more than the previous functions. This column is respectively called `categoric_effort`, `categoric_abundance` and `categoric_richness`. 2. Write a function called `plot_abundance()` with an argument called `df` with a data frame containing abundance data (see output of `get_abundance()`) and an argument called `scientific_name` (character). The function returns a bar plot of the abundance with the provided `scientific_name` in the title. 3. Edna must create the same plots with title and axis labels in Dutch for a workshop with citizen scientists. Can you improve `plot_abundance()` to handle it? You can use English title and labels as default values. --- class: left, top # Intermezzo 2: document with style The writer C. Bukowski once wrote that [_"Style is the answer to everything"_](https://genius.com/Charles-bukowski-style-annotated). Function documentation is essential while using R. How many times did you use the help (`?function_name`) in your daily woRk? So, let's document our functions with style! Stylish documentation can be done by following the [Roxygen2](https://roxygen2.r-lib.org/index.html) conventions as programmers writing functions for R packages do. Again, future-you and your colleagues will praise you. Do you know you can use the [`docstring`](https://github.com/dasonk/docstring) package to create help pages of your functions even if they are not in a package? Speaking about style, we, at INBO, follow the official and very stylish [INBO Styleguide for R code](https://inbo.github.io/tutorials/tutorials/styleguide_r_code/). Another good source of inspiration is the [tidyverse style guide](https://style.tidyverse.org/documentation.html). In between, you can use the [B-cubed software development guide](https://docs.b-cubed.eu/dev-guide/) mostly written by our colleague, Pieter. --- class: left, top # Intermezzo 2: document with style You can create a roxygen documentation Skeleton via `Code` -> `Insert Roxygen Skeleton`. Move that part in your stand-alone function and write your documentation. ```r install.packages("docstring") library(docstring) make_bread <- function(grains, yeast, water, salt) { #' Make bread #' #' Function to make bread out of grains, yeast, water and salt. #' #' @param grains Numeric vector containing the amount of grains. #' @param yeast Numeric vector containing the amount of yeast. #' @param water Numeric vector containing the amount of water. #' @param salt Numeric vector containing the amount of salt. #' #' @return Numeric vector containing the amount of bread. #' #' @examples #' # Make bread with 20 grains, 1 yeast, 2 water and 3 salt #' make_bread(20, 1, 2, 3) bread <- grains + yeast + water + salt return(bread) return(output) } ``` --- class: left, top # Intermezzo 2: document with style You can create a roxygen documentation Skeleton via `Code` -> `Insert Roxygen Skeleton`. Move that part in your stand-alone function and write your documentation. Call documentation via: ```r docstring(make_bread) # or just ?make_bread ``` --- background-image: url(/assets/images/background_challenge_3.png) class: left, top # Challenge 3: finalise the workflow We are almost there! In this challenge you will use Edna's code in section `# CHALLENGE 3 ####` of file `20250626_challenges.R`. 1. Write two functions called `plot_effort()` and `plot_richness()` to return a bar plot of effort and richness, respectively. These functions must allow Edna to create plots with title and axis labels in Dutch as well. Again, English texts are the default values. 2. Automatise the entire workflow (without the plotting step) by creating a macrofunction called `get_indicators()` with argument `year` (numeric) to read the right csv file. This function must return a list of 3 data frames named `effort`, `abundance` and `richness`. And do not forget to allow Edna to set custom breaks and labels for the categorical effort/abundance/richness. --- class: left, top # Intermezzo 3: Principles for commenting When writing functions, you can use comments to explain the code. But do not overdo it! The code should be **self-explanatory**. If you need to write a lot of comments, it is a sign that your code is not clear enough. Some principles for commenting: 1. **Comment the why, not the what**, e.g. why you use a specific function or why you use a specific approach. Pack as much information as possible in the code itself. 2. Comment the **tricky parts**, the **assumptions**, the **limitations** 3. Long, complex comments in the middle of your functions? Maybe worth to move them in the function documentation. Documentation is good, very good! 4. Use helper functions or explaining variables. Example: `is_non_empty_string()` is better than `!is.na(x) && nzchar(x)`. Most of this page is based on the blogpost [Why comment your code as little (and as well) as possible](https://blog.r-hub.io/2023/01/26/code-comments-self-explaining-code/). Thanks Pieter for sending it ;-) --- background-image: url(/assets/images/background_challenge_3.png) class: left, top # Bonus challenge Create a function called `plot_indicators()`. This function must have at least an argument called `indicators`, which is the list returned by `get_indicators()`. Probably you need other arguments as the function must allow Edna to create plots with title and axis labels in Dutch as well. The output is a list with three elements: - `effort`: a ggplot object with the effort plot as returned by `plot_effort()`. - `abundance`: a list of ggplot objects, one per species. Use the scientific names to name the list elements. Tip: you can use purrr package to loop over all species. Based on function `plot_abundance()`. - `richness`: a ggplot object with the richness plot as returned by `plot_richness`. --- class: left, top # The package of the month - Raïsa's choice: legendry The goal of [legendry](https://teunbrand.github.io/legendry/) is to provide additional guide functionality to the ggplot2 ecosystem. It provides a set of functions to create guides and legends for ggplot2 plots, which can be useful when you want to customize their appearance or when you want to create legends for plots that do not have a built-in legend. See the very well-written [guided tour](https://teunbrand.github.io/legendry/articles/tour.html). .center[] --- class:left, top # Resources - Commented solutions are available. Functions are saved in [20250626_functions_solutions.R](https://github.com/inbo/coding-club/blob/main/src/20250626/20250626_functions_solutions.R), while the code making use of the functions is saved in [20250626_workflow_solutions.R](https://github.com/inbo/coding-club/blob/main/src/20250626/20250626_workflow_solutions.R). You can opt to download the solutions automatically by using `inborutils::setup_codingclub_session("20250626")`. - Edited video recording is on [vimeo](https://vimeo.com/1097975857). The last part is missing. No idea why 🤷 Our apologies. Do you know that all INBO coding club video recordings are available on our official [INBO coding club vimeo folder](https://vimeo.com/user/8605285/folder/1978815?isPrivate=false)? - Do you want to learn more about functions? Get a more [formal framework](https://www.stat.berkeley.edu/~statcur/Workshop2/Presentations/functions.pdf), go [in depth](http://adv-r.had.co.nz/Functions.html#function-arguments), do a check [under the hood](http://swcarpentry.github.io/swc-releases/2017.08/r-novice-inflammation/14-supp-call-stack/) or learn more about [programming with `dplyr`](https://dplyr.tidyverse.org/articles/programming.html). - The [INBO styleguide for R code](https://inbo.github.io/tutorials/tutorials/styleguide_r_code/). - The [B-Cubed software development guide](https://docs.b-cubed.eu/dev-guide/). - Some advices from [tidyverse style guide](https://style.tidyverse.org/documentation.html) can also be useful. - Blogpost ["Why comment your code as little (and as well) as possible"](https://blog.r-hub.io/2023/01/26/code-comments-self-explaining-code/). - Packages [Roxygen2](https://roxygen2.r-lib.org/index.html) and [docstring](https://github.com/dasonk/docstring). - The [checklist](https://packages.inbo.be/checklist/index.html) package: a set of checks for R projects and R packages, created and maintained by our Thierry! - The [usethis](https://usethis.r-lib.org/index.html) package: a workflow package, useful for both for R packages and projects. - The [legendry](https://teunbrand.github.io/legendry/) package: push ggplot2 guides and legends to the next level. --- class: left, top We take a break in July. Have a nice summer! Let's meet again end August. .center[] We wish you an unforgettable summer full of dinos, dragons and adventures! <small>It's a [plesiosaurus](https://en.wikipedia.org/wiki/Plesiosaurus), found at https://www.asciiart.eu/animals/reptiles/dinosaurs. 🦖</small> --- class: center, middle  <!-- Adjust the room and date --> Room: 01.72 - Kaat Tilley <br> Date: __26/08/2025__, van 10:00 tot 12:30<br> Subject: visualise spatial data in R <br> (registration announced via DG_useR@inbo.be)