class: center, top  <!-- Do not forget to adapt the presentation title in the header! --> <!-- Adjust the presentation to the session. Focus on the challenges, this is not a coding tutorial. Note, to include figures, store the image in the `/docs/assets/images` folder and use the jekyll base.url reference as done in this template or see https://jekyllrb.com/docs/liquid/tags/#links. using the scale attribute , you can adjust the image size. --> <!-- Adjust the day, month --> # 26 AUGUST 2025 ## INBO coding club <!-- Adjust the room number and name --> Herman Teirlinck<br> 01.72 - Kaat Tilley --- class: left, top # Reminders 1. Did we confirm the room reservation on the _roomie_? 2. Did we start the recording? --- class: center, middle <!-- Create a new badge using Inkscape based on the assets/images/coding_club_badges.svg file -->  --- class: left, top What do we mean with geospatial data? ### Spatial vector data Points, lines, polygons, etc were the topic of the coding club of [24 April 2025](https://inbo.github.io/coding-club/sessions/20240528_spatial_data_in_r_with_sf.html#1). - **sf** : newest and recommended package - **sp** : its predecessor (retired) ### Spatial raster data It's quite a lot of time we don't work with rasters: last time was during the coding club of [24 November 2022](https://inbo.github.io/coding-club/sessions/20221124_coding_club_rasters.html). - [**terra**](https://rspatial.github.io/terra/reference/terra-package.html) : newest and recommended package - [**raster**](https://rspatial.org/raster/pkg/index.html) : its predecessor (no support for sf), match with sp - [**stars**](https://r-spatial.github.io/stars/): for **s**patio**t**emporal **ar**ray**s**. Important for people involved in remote sensing where data often comes in the form of dense arrays, with space and time being array dimensions. For more info, read this great [article](https://geocompx.org/post/2021/spatial-classes-conversion/) about conversions among different spatial classes in R. --- class: left, top # Today Today we play around the visualisation of **spatial vector data** only. No raster data! --- class: left, top # Plot vs maps You can **plot** geospatial data. But a plot is not a map, as chocolate is not (yet) a chocolate pie. You need one "ingredient" more. What do we need? 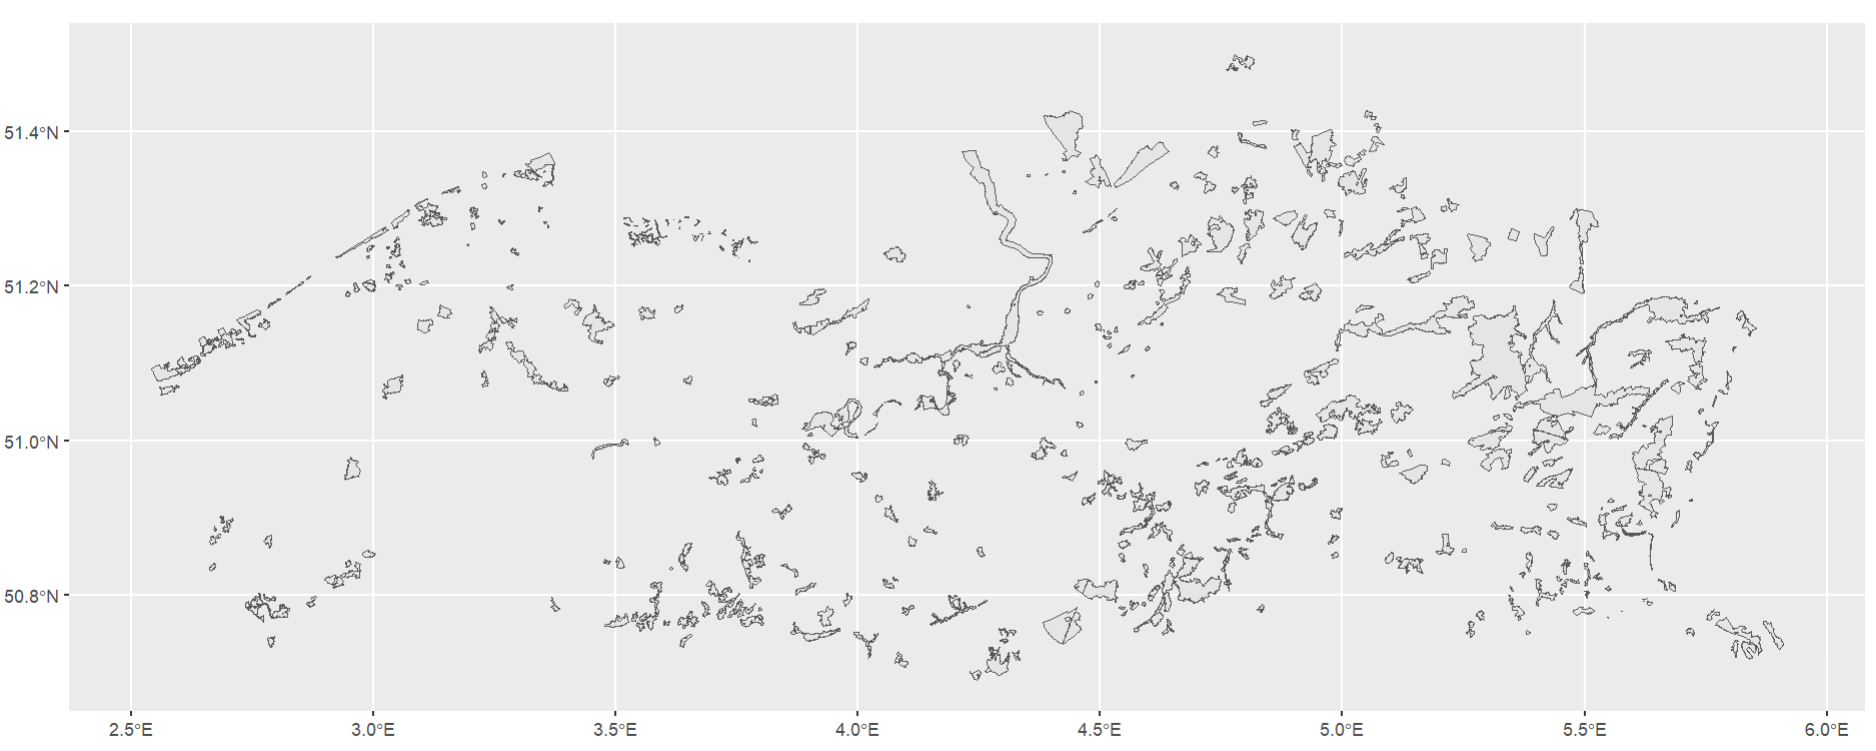 --- class: left, top # From plots to maps You need **tiles**. 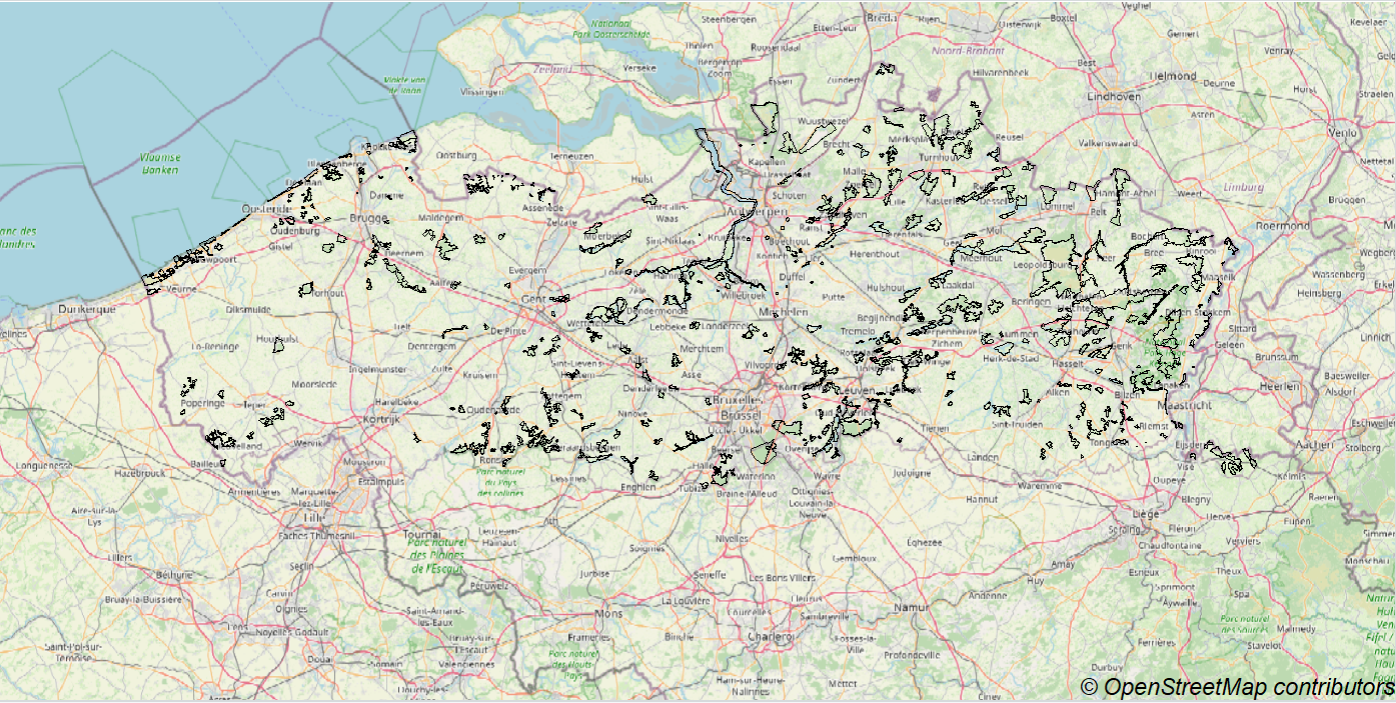 Example above uses [OpenStreetMap](https://www.openstreetmap.org/) tiles. --- class: left, top # Tiles There are a lot of tiles. Some are available for being used with an open license, others not. Tiles are nothing more than images (pngs or jpgs). They are tiny small images that are put together to form a map. The tiles are usually 256x256 pixels and are arranged in a grid. The tiles are generated by a server and are requested by the client (your browser) when you zoom in or out on a map. There are tiles covering the entire world, or just a specific region. For Flanders, see the [Web Map (Tile) Service](https://www.vlaanderen.be/digitaal-vlaanderen/onze-oplossingen/geografische-webdiensten/ons-gis-aanbod/raadpleegdiensten#wat-is-een-wmts) (WMTS) of the Flemish Authority. So, if you have ever seen a map on the web, you have seen tiles! And if you have ever heard a "know-it-all expert" speaking about WMTS, well, do not be afraid about that! --- class: left, top # Static vs dynamic maps **Static maps**: the data visualised on the map and the background tiles are fixed: no zooming in/out. Easy for pdfs or other static content. **Dynamic maps**: zooming in/out is possible. Perfect for web pages. No PDFs! --- class: left, top ## Dynamic maps: leaflet vs mapview [Leaflet](https://leafletjs.com/) is a very popular JavaScript library for interactive maps by [Vladamir Agafonkin](http://agafonkin.com/en/). The R package [leaflet](https://rstudio.github.io/leaflet/) is a wrapper for that library. It allows to create interactive maps that can be embedded in a web page. The package is very flexible and allows to create maps with a lot of functionalities. The documentation is wonderful and there are a lot of examples available (check the "Articles"!). However, if you are looking for a quick and easy way to create interactive maps, you can use [mapview](https://r-spatial.github.io/mapview/), which at some extent can be considered a wrapper of the leaflet package. It allows to create interactive maps with just one line of code (= less verbose). It is very useful to quickly explore your data and to create maps probably good enough for presentations or reports. The documentation is also very good and there are a lot of examples available in the "Articles". Last but not least, "it makes use of some advanced rendering functionality that will enable viewing of much larger data than is possible with leaflet"*. <small> \* Source: [mapview documentation](https://r-spatial.github.io/mapview/index.html)</small> --- class: left, top ## Dynamic maps: leaflet vs mapview We already used mapview during the coding club of April to easily visualise what we were doing. Today we build up from basic commando `mapview(my_sf_object)`: ``` mapview(breweries) ``` And see what happens! Try clicking on a circle: beautiful, isn't? --- class: left, top ## Geospatial visualisation in R Geospatial visualisation in R is evolving fast. The packages are numerous and the choice is not always easy. The [R-Spatial CRAN Task View](https://github.com/cran-task-views/Spatial/tree/main)* is a handy source to get an updated overview of R spatial packages. See section related to [visualisation](https://github.com/cran-task-views/Spatial/blob/main/Spatial.md#visualizing-spatial-data). Another tip: choose packages actively maintained! <small>* The CRAN Task View is a curated list of R packages for a particular task. It is maintained by the community. And thanks Floris Vanderhaeghe for the tip!</small> --- class: left, top ## INBO goes spatial Do you know INBO is very active in spatial data? Just think about qgisprocess package (see coding club of Dec 2023).But check also the R package [inbospatial](https://github.com/inbo/inbospatial): a collection of useful R functions for spatial data.  --- class: left, top # Packages used today Today we will mainly use: - [ggplot2](https://ggplot2.tidyverse.org/): allows to plot geospatial vector data. No maps! - [ggspatial](https://paleolimbot.github.io/ggspatial/index.html): a tidy framework for interacting with spatial data using ggplot2 behind the screen. - [mapview](https://r-spatial.github.io/mapview/): we have just spoken about it. --- class: left, top ## Install and load packages ```r # Load the packages and install if needed required_packages <- c( "sf", "tidyverse", # In place of ggplot2, dplyr, readr "mapview", # For (leaflet) maps "leafpop", # For popups of leaflet maps "leafem", # For providing extensions to leaflet maps "ggspatial", # For making static maps with ggplot "ggrepel", # For avoiding label overlapping "prettymapr", # For using map tiles with ggspatial "raster", # For using map tiles with ggspatial "inbospatial" # For using useful R functions for dealing with spatial data ) # Install packages not yet installed installed_packages <- required_packages %in% rownames(installed.packages()) if (any(installed_packages == FALSE)) { if (!"https://inbo.r-universe.dev" %in% getOption("repos")) { # Install inbospatial via GitHub devtools::install_github("inbo/inbospatial") # Remove inbospatial from the list of packages to install required_packages <- required_packages[required_packages != "inbospatial"] } # Install packages not yet installed install.packages(required_packages[!installed_packages]) } # Load packages invisible(lapply(required_packages, library, character.only = TRUE)) ``` --- class: center, top ### How to get started? Check the [Each session setup](https://inbo.github.io/coding-club/gettingstarted.html#each-session-setup) to get started. ### First time coding club? Check the [First time setup](https://inbo.github.io/coding-club/gettingstarted.html#first-time-setup) section to setup. --- class: left, top  <br> No yellow sticky notes online. We use hackmd (see next slide) but basic principle doesn't change. --- class: center, top ### Share your code during the coding session! <!-- Create a new hackmd file and replace this link (twice!) --> Go to https://hackmd.io/DsuDuIKjS4uPkg8CWQdUAA?edit <iframe src="https://hackmd.io/DsuDuIKjS4uPkg8CWQdUAA?edit" height="450px" width="800px"></iframe> --- class: left, top # Download data and code - Download everything automatically via `inborutils::setup_codingclub_session()` - manually*, from [data/20250826](https://github.com/inbo/coding-club/blob/master/data/20250826/) and [src/20250826](https://github.com/inbo/coding-club/blob/master/src/20250826). Place the R script in your folder `src/20250826/` and data in `data/20250826/`. <small>* __Note__: check the getting started instructions on [how to download a single file](https://inbo.github.io/coding-club/gettingstarted.html#each-session-setup)</small> --- class: left, top # Data and code files description 1. [20250826_giant_hogweed_fl_bxl.tsv](https://github.com/inbo/coding-club/blob/master/data/20250826/20250826_giant_hogweed_fl_bxl.tsv): tab-separated text file with the occurrences of giant hogweed (_Heracleum Mantegazzianum_) in Flanders and Brussels*. 2. [20250826_giant_hogweed_per_municipality.gpkg](https://github.com/inbo/coding-club/blob/master/data/20250826/20250826_giant_hogweed_per_municipality.gpkg)*: geopackage with Flemish and Brussels municipalities. Column `n` contains the number of giant hogweed occurrences. 3. [20250826_challenges.R](https://github.com/inbo/coding-club/blob/master/src/20250826/20250826_challenges.R): R script to start from. <small>\* Occurrences are derived from GBIF.org (22 April 2025) GBIF Occurrence Download https://doi.org/10.15468/dl.2bptj3. Municipalities are derived from https://data.gov.be/nl/datasets/httpswwwodwbbeexploredatasetcommunesgemeente-belgium. </small> --- background-image: url(/assets/images/background_challenge_1.png) class: left, top # Challenge 1 - dynamic maps **IMPORTANT**: The code to read the spatial files is provided! Using [mapview](https://r-spatial.github.io/mapview/): 1. Create a map with the number of giant hogweed occurrences in the municipalities of Flanders and Brussels. The color of the municipalities should represent the number of occurrences. Display the legend. Set the color of the municipality borders to white. Hint: [mapview basics](https://r-spatial.github.io/mapview/articles/mapview_01-basics.html). 2. Let's fine tune the previous map. Set the opacity of the areas to 0.8 and the contour lines to 0.5. Set `"Number of giant hogweed occurrences"` as legend title and layer name. Show only `mun_name_nl`, `mun_name_fr` and `n` in the popups. Hint: [mapview advanced controls](https://r-spatial.github.io/mapview/articles/mapview_02-advanced.html) and [mapview popups](https://r-spatial.github.io/mapview/articles/mapview_04-popups.html). 3. Allow Open Street Map tiles only. Hint: see [mapview advanced controls](https://r-spatial.github.io/mapview/articles/mapview_02-advanced.html). 4. Working with multiple layers is possible. For example, you can add the points with the occurrences of giant hogweed on top of the previous map. The code to read the occurrences is provided. Set the color of the points to gray80 and the size to 5. Set also the layer name as `"Giant hogweed occurrences"`. Hint: see section ["Multiple layers"](https://r-spatial.github.io/mapview/articles/mapview_02-advanced.html#multiple-layers). 5. Add the mouse coordinates (lat, lon) and zoom level. Hint: check the [extra leaflet functionalities](https://r-spatial.github.io/mapview/articles/mapview_06-add.html) vignette. 6. Extra: save the map as html file. No hint this time :-) --- background-image: url(/assets/images/background_challenge_2.png) class: left, top # Challenge 2 - plots **IMPORTANT**: The code to read the spatial files is provided! 1. How to plot the municipalities of Brussels (`n_giant_hogweed_bxl`) with ggplot? Hint: see documentation of the [geom_sf](https://ggplot2.tidyverse.org/reference/ggsf.html) function or the general hint below. 2. Now, try to **fill** the municipalities based on the number of giant hogweed occurrences (column `n`). This kind of map is known as **choropleth map**. Set also the borders of the municipalities to red. 3. Add the municipality names in Dutch (`mun_name_nl` column) as labels. Show them in gray50 color, with fontsize 2 and bold style. 4. A pure ggplot question: **scale** the color using the **c**ontinuous **viridis** palette. Hint: see documentation of the [scale_fill_viridis](https://ggplot2.tidyverse.org/reference/scale_viridis.html) family of functions. 5. Depending on the size of the plot, you could get overlapping labels. How to avoid them? Hint: see the general hint below, section "Labels". Try also to reproduce the same padding around the labels as done by default with ggplot in 3. **General hint**: Follow the first part of this nice [tutorial](https://r-charts.com/spatial/maps-ggplot2/) from R CHARTS! --- background-image: url(/assets/images/background_challenge_3.png) class: left, top # Challenge 3 - static maps Let'use [ggspatial](https://paleolimbot.github.io/ggspatial/) to create static maps. This package is actively maintained and it's getting better with time. 1. Let's add now map tiles from OpenStreetMap (default) as background. Is the resolution of the automaticaly chosen zoom level not enough? Increase it, but still do not hardcode the zoom level. Hint: Type `?annotation_map_tile` in the R console to get help. 2. Add caching option to avoid downloading the tiles each time you run the code. 3. Add a north arrow at the top right corner of the map and a scale bar at the bottom left corner. Hint: see [dedicated section](https://paleolimbot.github.io/ggspatial/articles/ggspatial.html#using-north-arrow-and-scalebar) in ggspatial article. 4. Which other tiles you can use with `annotation_map_tile()`? Test them and let's find your favourite ones. --- class: left, top # Bonus challenge: inbospatial Among other things, inbospatial provides a lot of layers! 1. Create a map with the occurrences of giant hogweed as circles and a layer related to the public forest and nature areas managed by the [Flemish Nature & Forest Agency](https://www.natuurenbos.be/). Add also the legend for such areas. 2. Add to the previous map the GRB basemap (Grootschalig Referentiebestand): these map tiles have very good detailed borders of municipalities. Hint: check the documentation ["adding WMS tiles"](https://inbo.github.io/inbospatial/reference/add_wms.html). NOTE: while trying adding these layers it could be that you get an error saying you need to install some extra leaflet packages: `leaflet.extras` and `leaflet.extras2`. Install them and try again. OPEN QUESTION: how to add the correspondent layer/tile names in mapview? Maybe you can get this solved! Let you hear via the hackmd. --- class: left, top # Bonus challenge 2: add your own GPS location Happy to add a question I got from Robrecht: how to add my own GPS location to a map? --- class: left, top ## Leaflet extra exercises Leaflet or not to leaflet? It's up to you! You can stick to work with mapview or you can go full throttle with leaflet. Check the bonus challenges of the INBO coding club of August 31, 2023 for more inspiration. The [leaflet for R](https://rstudio.github.io/leaflet/) documentation is one of the best package documentations ever written, that's for sure! --- class: left, top # The packages of the month - Pieterjan's choice Do you dream of switching from static to dynamic maps with one line of code? Well, give [tmap](https://r-tmap.github.io/tmap/) a try! Give a look to the [Get Started](https://r-tmap.github.io/tmap/articles/tmap-getstarted.html) page: ``` tmap_mode("view") # to dynamic maps tmap_mode("plot") # to static maps ``` Less flexible than mapview but the possibility to switch from static to dynamic visualisation is really a nice-to-have.  --- class: left, top # The packages of the month (advanced) - Pieters's choice Have you already used the [targets](https://docs.ropensci.org/targets/) R package and have you ever struggled to include geospatial data formats in your worklows? The package [geotargets](https://docs.ropensci.org/geotargets/) can help you!  --- class: left, top # Resources - [Commented solutions](https://github.com/inbo/coding-club/blob/main/src/20250826/20250826_challenges_solutions.R) are available on GitHub. You can opt to download the solutions automatically by using `inborutils::setup_codingclub_session("20250826")`. - Edited video recording is on [vimeo](https://vimeo.com/1115398489?share=copy#t=0). Do you know that all INBO coding club video recordings are available on our official [INBO coding club vimeo folder](https://vimeo.com/user/8605285/folder/1978815?isPrivate=false)? - [ggplot2](https://ggplot2.tidyverse.org/): our standard package for plots, which can also be used for displaying spatial data. - [ggspatial](https://paleolimbot.github.io/ggspatial/index.html) documentation. Suit well for static maps and ggplot2 compatible. - Are you a ggplot fan? The package [ggmap](https://github.com/dkahle/ggmap#readme) is also something you will enjoy! - [mapview](https://r-spatial.github.io/mapview/) documentation. - [leaflet](https://rstudio.github.io/leaflet/) for R documentation. - [leafem](https://r-spatial.github.io/leafem/) documentation. - [inbospatial](https://github.com/inbo/inbospatial): a collection of useful R functions for spatial data made in INBO. - [tmap](https://r-tmap.github.io/tmap/) documentation. - [geotargets](https://docs.ropensci.org/geotargets/) documentation. --- class: center, middle  <!-- Adjust the room number and name --> Room: HT - 01.17 - Clara Peeters <br> Date: **25/09/2025**, van **10:00** tot **12:30** <br> Subject: not yet decided <br> (registration announced via DG_useR@inbo.be)